
Getting Ready for the Roof to Fall [¹]
By Jonathan R. Laing, Barron's | 29 September 2007
For celebrated bond fund manager Jeffrey Gundlach, the intensifying meltdown in the U.S. housing market has all the inevitability of a Sophoclean tragedy.
The Chief Investment Officer of Santa Monica, Calif.-based TCW Group has been sounding warnings for more than a year that mortgage lenders had taken leave of their senses by spooning out mortgages without owner-equity cushions and with little or no verification of the borrowers' ability to pay back the debt.
By now, with mortgage defaults climbing and home sales falling, the plot line of this drama is becoming clear. But Gundlach says there are still several acts to come— and that the curtain may not come down until the close of this decade. He sees U.S. home prices dropping an average of 12% to 15% annually from the highs achieved last year and not reaching their eventual trough until late 2008, at the earliest. And they may not start recovering until 2010 or 2011, inflicting, in the meantime, real damage on the economy.
About the only bright spot: the mortgage market may offer some excellent investment opportunities in the year ahead, he says.
Gundlach was among the first to rail against the profusion of new types of home loans— interest-only mortgages, adjustable-rate mortgages with artificially low teaser interest rates in the early years of repayment, and so-called option ARMs, which allowed borrowers to make monthly payments that didn't even cover interest costs— all of them designed, in Gundlach's phrase, to "shoehorn" borrowers into homes often far beyond their financial means.
Sure enough, all these dicey loans helped bring about what Gundlach now calls "the great margin call of 2007." As home-price appreciation flamed out, subprime borrowers began to default in droves, especially on new mortgages, and mail back the keys to lenders. As a consequence, major subprime mortgage lenders like New Century began hitting the wall. Ultimately more than 100 subprime lenders were forced to close their doors as Spring turned into Summer.
That was followed in June by disclosure that two hedge funds managed by Bear Stearns were in deep trouble because of highly-leveraged subprime-debt bets that had gone bad. Soon a number of hedge funds, banks and other financial institutions from Asia and North America to Europe were reporting heavy losses on subprime debt investments. A number of hedge funds ended up being liquidated, and banking authorities in Germany and England were forced to arrange hasty bail-outs to save various banks.
The financial markets were further shocked in July and August when Moody's and Standard & Poor's and Fitch belatedly took over 5,000 negative ratings actions, decimating prices on all manner of residential mortgage-backed and home equity loan securities. "This was the biggest credit ratings catastrophe that our markets have ever seen," Gundlach observed to Barron's during a lengthy telephone interview.
Soon, the subprime contagion spread to other markets— from leveraged-buyout debt to asset-backed commercial paper, triggering a full-scale seizing up of global credit markets. Yields on risky debt paper soared. Buyers went on strike. The ascendancy of fear over greed forced central bankers to flood their financial systems with liquidity, and in the case of the Fed two weeks ago, to drop short-term interest rates.
As the rest of the tragedy unfolds, the pain may be especially bad in what Gundlach calls "the bubble markets" of California, Florida, Nevada and Arizona and hard-hit Rust Belt areas in Michigan, Ohio and Indiana. Housing prices in those locales will likely fall 30% to 40%, he maintains.
His pessimism is grounded in some two decades of trading mortgage-backed securities and analyzing homeowner behavior with the underlying loans. He lived through, for example, the housing bear-market of 1989 to 1993 that saw home prices fall 30% to 40% in some overextended markets like Boston and Orange County. In his opinion what happened in some of those pockets of price weakness may be but a dress rehearsal of what impends for broader swaths of the country.
Moreover, the worrisome trends in mortgage delinquencies, defaults and foreclosures figure to accelerate in the months ahead. That's because next year and early-2009 will see a crescendo in the troubled 2006 and early-2007 subprime mortgage vintages reaching their two-year rate reset points, when the low teaser rates expire. Facing jumps in monthly payments of 30% or more, many homeowners are likely to just throw in the towel and default on their mortgages.
Worse, Gundlach doesn't see much chance of a recovery in home prices until still later. Housing cycles in his experience typically trace elongated U-shapes rather than the V-type patterns so often seen in stock markets. For one thing, home-price information is often episodic and poorly-reported. Too, housing market fundamentals take a long time to play out, making shifts in market psychology far less mercurial than in the stock market.
It's easy to dismiss such dark ruminations. After all, Gundlach is a fixed-income guy. And at least up to a point, bad news is good news in the bond market. A slowing economy, for example, eventually causes the prices of high-quality bonds to rally as a result of reduced inflation expectations and less demand for credit. At the same time, the differences among yields on bonds of varying credit quality often widen to better reflect levels of risk, allowing investment managers like Gundlach to be more properly compensated for any risks they may take.
He is still agog at the galvanic moves in yield spreads that occurred last month at the height of the global crunch. Yields on top-rated asset-backed commercial paper that on Aug. 8 traded at just 41 basis points (or hundredths of a percentage point) over the three-month T-Bill rate soared to 289 basis points over on August 20 before settling back to around 185 basis points over. "This is what happens when the ocean of liquidity that everybody was talking about just a couple of months ago has turned into a swamp of troubled debt," Gundlach observes.
But Gundlach is more than a mere bondo spoilsport. Indeed, he has earned much street cred over the years. He was named Morningstar Fixed Income Manager of the Year for 2006 after being a finalist for the three previous years. The $900 million TCW Total Return Bond Fund, which he has co-run for some two decades, has been a top-performer in credit cycle after cycle, finishing in the second percentile of the Morningstar universe of intermediate-term bond funds for the 10 years ended Aug. 31 and in the seventh percentile for the year ended Sept. 27. In all, Gundlach has direct control over some $90 billion in fixed-income portfolios at TCW, mostly for institutional investors.
"His performance has been all the more remarkable since he has done it by mostly focusing on the mortgage-backed securities, while many of his peers have much more flexibility in what they own," says Morningstar analyst Lawrence Miller. "And this year he has done well, despite all the convulsions in the mortgage-debt sectors, by concentrating on high-quality paper, much of it guaranteed by government and quasi-government agencies like Fannie Mae."
Gundlach was early in seeing the virulence of the housing slump that the subprime debt excesses would spawn. In a Barron's Current Yield column last December he opined that the U.S. housing bust was merely in its "early innings" and would likely continue well into 2008 because of subprime-debt problems. At the time, no less a personage than former Fed chairman Alan Greenspan claimed that stabilizing new mortgage applications indicated the housing market had already bottomed.
To Gundlach, the problem is not so much the losses that investors in the U.S. and around the globe will take on the $2 trillion or so of subprime and "Alt-A" mortgage-backed securities and collateralized debt obligations that are currently outstanding. Those losses will probably top out at around $300 billion, which, in his estimation, constitutes a rounding error in a $14 trillion economy.
The problems lie in the knock-on effects that subprime is having and will continue to have on the economy. Gundlach asserts that the mortgage-triggered housing downturn has already cost GDP about one and half percentage points of growth. That negative impact figures to intensify some in the quarters ahead.
Increasing defaults and foreclosures will add to an already swollen inventory of unsold homes that now stands by some reckonings at 10 months. As last week's August numbers showed, new home sales are continuing their descent, falling over 20% year-over-year.
Likewise, says Gundlach, demand for housing is likely to continue to suffer as now-timorous lenders and mortgage bond investors pull back from the market. And dicey subprime mortgages exist at all price points of the housing food chain, from the most modest starter homes up to fancy $700,000 homes.
Housing woes, of course, radiate far into the general economy. Housing accounts for a big chunk of U.S. employment when one takes into account all the construction, finance and retail jobs that depend on a strong housing market. Consumer confidence and spending suffer mightily when cash-out refinancings dry up and the value of most families' primary asset falls in value.
Gundlach and TCW haven't emerged completely unscathed by the current credit crunch. Two weeks ago, TCW was forced to liquidate a $3.2 billion mortgage-backed CDO it managed called Westway's Funding X, when the market price of certain tranches fell below certain levels. There was nothing wrong with any of the assets backing the CDO. "They were of pristine quality and performed fine," says Gundlach. It was just a case of market jitters that led to the price markdowns.
But overall Gundlach is salivating at all the mortgage-market investment opportunities that are likely to emerge in the quarters ahead. TCW has already raised $1.6 billion from various institutional investors for a new vulture fund. After all, one investor's grief can be another's opportunity.
The Bottom Line
As the housing slump deepens, the toll on the American economy could be severe. Already, it has cost GDP one-and-a-half percentage points of growth; and median U.S. home prices are unlikely to recover until the decade's end..
Normxxx
______________
The contents of any third-party letters/reports above do not necessarily reflect the opinions or viewpoint of normxxx. They are provided for informational/educational purposes only.
The content of any message or post by normxxx anywhere on this site is not to be construed as constituting market or investment advice. Such is intended for educational purposes only. Individuals should always consult with their own advisors for specific investment advice.
Saturday, September 29, 2007
Is It To Be Inflation OR Deflation, Fire Or Ice?
Inflation versus deflation debate for Red Pill consumers [¹]
Click here for link to complete article,
 By Eric Janszen, iTulip.com | 29 September 2007
Reading Hudson and Phillips is like taking the Red Pill. If you're not familiar with the movie The Matrix, the Red Pill is the one you take if you want to see past the surface illusion of the made-up world. Once you read Hudson and Phillips, no matter whether you agree with their solutions, it's hard to go back to seeing the economy as anything but two distinct economies: the great, big FIRE Economy and the itty bitty Production/Consumption Economy.
Inflation versus deflation: Red Pill view
For readers who've taken the Red Pill, the inflation vs deflation discussion needs to be put into the context of the FIRE and P/C Economies.
FIRE Economy Failure?
When we interviewed Dr. Hudson, he didn't buy our Next Bubble idea. He believes that the FIRE Economy will gradually fail. He calls it the "slow crash." In that case demand declines within the P/C Economy as Japan experienced. Does that mean the US experiences deflation as Japan did? Japan was a net creditor when its FIRE Economy began a slow crash starting in 1992. The US was also a net creditor when its FIRE Economy crashed hard in the 1930s. For net creditors, as asset price deflation within the FIRE Economy spills over into the P/C Economy, the impact on interest rates and currency values is deflationary for wage and goods prices. For net debtors, on the other hand, the impact is the opposite: interest rates rise and currency values fall as capital flows reverse, ala Ka-Poom Theory. We believe failure of the FIRE Economy therefor means inflation.
Mike (Mish) Shedlock believes the banks can't be resuscitated once the credit defaults get rolling (see Death Spiral Financing). Rick Ackerman and Gary North are in the same camp. In Red Pill terms, they believe excessive debt levels and credit derivatives will swamp and wreck the FIRE Economy, taking the P/C Economy down with it.
I got into the topic with GaveKal CEO Louis-Vincent Gave on Sunday (interview here). His case for deflation in Europe is well articulated and specific: run-away asset price deflation happens because there is no euro bond market like the US and Japan have dollar and yen bond markets, each connected to a national central bank. The euro is a multinational political animal, with no centralized means to inflate.
The euro's lack of a euro bond market was first pointed out to us in our interview with Jamie Galbraith (JK's son) earlier this year when we were asking victims of various interviews: "What sort of international monetary regime after this one turns turtle?" It was one of those slap-your-forehead moments we hope to experience at least once in each interview we conduct. Jamie said a multilateral dollar-yen-euro regime depends on the development a euro bond market— so don't hold your breath.
The Road to Inflation
The inflation versus deflation debate was re-ignited by the Fed's 50 basis point rate shock therapy last week. Readers of pundits in the deflation camp demanded to know, "The long awaited credit meltdown is here. Where's the deflation? Gold and oil are going through the roof!"
Hudson’s prediction of the decline of the FIRE Economy is more or less a traditional Marxist one, that total interest payments eventually exceed the economy’s debt carrying capacity. At some point there’s a "break in the chain of payments," and the system collapses. Preventing such a break is what the Fed has been up to for the past few weeks, and the Bank of England is still doing for Barclays and other banks today.
No one knows whether the FIRE Economy is doomed or not. But its imminent demise has been prematurely announced many times over the past 20 years. I heard similar arguments from Marxist economics professors in college in the early 1980s. Now you can hear them from Libertarians, too.
Our Red Pill conclusion is that to keep the FIRE Economy running until the Next Bubbles get going, the Fed is willing to risk inflation in the P/C Economy, thus the 50 basis point cut while inflation is at multi-year highs and the dollar at multi-year lows. A bit of extra heat from the 1/10th HP heater is a necessary cost of preserving the 400 HP engine; once the FIRE Economy is firing on all cylinders again, P/C Economy inflation can be brought back under control. And, in the unlikely case that the FIRE Economy fails, expect massive capital outflows, a collapsing dollar and inflation as Mexico experienced in the late 1980s.
Either way, we don't see wage and goods price deflation in our future.
M O R E. . .
Normxxx
______________
The contents of any third-party letters/reports above do not necessarily reflect the opinions or viewpoint of normxxx. They are provided for informational/educational purposes only.
The content of any message or post by normxxx anywhere on this site is not to be construed as constituting market or investment advice. Such is intended for educational purposes only. Individuals should always consult with their own advisors for specific investment advice.
Click here for link to complete article,
By Eric Janszen, iTulip.com | 29 September 2007 - The inflation versus deflation debate keeps contrarian economics and finance pundits pontificating for ten fabulous years. Fed flushes banks with funds and a fresh flurry of articles fills the blogosphere. Finally, the "financial economy" enters.
- "I would argue the most critical reformation in the past twenty years since Volcker’s prime has been the transition of the U.S. from a manufacturing/to a service/to a finance-based economy within the span of two decades. Purists will perhaps rightly quarrel with the chronology or maybe even the logic, but it seems to me in any case that the critical difference between then and now is that profits and employment— 2/3 of the critical constituents that a Fed Vigilante must protect (inflation being the third)— are now primarily a function of the amount of debt/leverage and its cost."
- Phillips uses the term "financialization" to describe how the U.S. economy has been radically restructured from a focus on production, manufacturing and wages, to a focus on speculation, debt, and profits. Since the 1980s, Phillips argues in American Theocracy,
- "...the underlying Washington strategy… was less to give ordinary Americans direct sums than to create a low-interest-rate boom in real estate, thereby raising the percentage of American home ownership, ballooning the prices of homes, and allowing householders to take out some of that increase through low-cost refinancing. This triple play created new wealth to take the place of that destroyed in the 2000-2002 stock-market crash and simultaneously raised consumer confidence.
"Nothing similar had ever been engineered before. Instead of a recovery orchestrated by Congress and the White House and aimed at the middle— and bottom-income segments, this one was directed by an appointed central banker, a man whose principal responsibility was to the banking system. His relief, targeted on financial assets and real estate, was principally achieved by monetary stimulus. This in itself confirmed the massive realignment of preferences and priorities within the American system….
"Likewise huge and indisputable but almost never discussed were the powerful political economics lurking behind the stimulus: the massive rate-cut-driven post-2000 bailout of the FIRE sector, with its ever-climbing share of GDP and proximity to power. No longer would Washington concentrate stimulus on wages or public-works employment. The Fed's policies, however shrewd, were not rooted in an abstraction of the national interest but in pursuit of its statutory mandate to protect the U.S. banking and payments system, now inseparable from the broadly defined financial-services sector."
- "The exponential growth of savings and debt takes the form mainly of loans to finance the purchase of real estate, stocks and bonds. These loans extract interest and amortization charges that divert revenue away from being spent on goods and services. The payment of debt service by the economy’s non-financial sectors interrupts the circular flow that Say’s Law postulates to exist between producers and consumers."
Reading Hudson and Phillips is like taking the Red Pill. If you're not familiar with the movie The Matrix, the Red Pill is the one you take if you want to see past the surface illusion of the made-up world. Once you read Hudson and Phillips, no matter whether you agree with their solutions, it's hard to go back to seeing the economy as anything but two distinct economies: the great, big FIRE Economy and the itty bitty Production/Consumption Economy.
Inflation versus deflation: Red Pill view
For readers who've taken the Red Pill, the inflation vs deflation discussion needs to be put into the context of the FIRE and P/C Economies.
- Fed monetary policy for the FIRE Economy is distinct from monetary policy for the P/C Economy.
- Continuous asset price inflation is the objective of FIRE Economy monetary policy. Within the residential real estate market these policies have been effective until recently. They continue to work in the commercial real estate market, but perhaps for not much longer, starting with retail.
- Low wage inflation is the primary objective of P/C Economy monetary and government policy because wages are the mechanism for transmission of inflation into the inflation cycle. Wage inflation can be managed via immigration policy, outsourcing policy to affect global wage arbitrage, and so on.
- Payments within the FIRE Economy may be 100 or more times the total payments within the P/C Economy.
- This does not mean that small changes in FIRE Economy growth have an out-sized impact on the P/C Economy. The opposite is true. The FIRE Economy is a 400 HP car engine in your car and the P/C economy as the 1/10th HP heater that warms your car with the waste heat from the engine.
- Asset price inflation and deflation occurs within the FIRE Economy without a direct impact on wages and goods prices within the P/C Economy. For example, housing price asset inflation ran more than 10% per year between 2002 and 2005 while consumer price inflation remained in the low single digits. Conversely, asset price deflation can occur in the FIRE Economy without necessarily leading to wage and goods price deflation in the P/C Economy.
- However, as the Japanese learned in the 1990s, sustained banking system dysfunction (inability to multiply the money supply) and asset price deflation in the FIRE Economy, with asset price deflation continuing for years on end, eventually spills over into the P/C economy.
FIRE Economy Failure?
When we interviewed Dr. Hudson, he didn't buy our Next Bubble idea. He believes that the FIRE Economy will gradually fail. He calls it the "slow crash." In that case demand declines within the P/C Economy as Japan experienced. Does that mean the US experiences deflation as Japan did? Japan was a net creditor when its FIRE Economy began a slow crash starting in 1992. The US was also a net creditor when its FIRE Economy crashed hard in the 1930s. For net creditors, as asset price deflation within the FIRE Economy spills over into the P/C Economy, the impact on interest rates and currency values is deflationary for wage and goods prices. For net debtors, on the other hand, the impact is the opposite: interest rates rise and currency values fall as capital flows reverse, ala Ka-Poom Theory. We believe failure of the FIRE Economy therefor means inflation.
Mike (Mish) Shedlock believes the banks can't be resuscitated once the credit defaults get rolling (see Death Spiral Financing). Rick Ackerman and Gary North are in the same camp. In Red Pill terms, they believe excessive debt levels and credit derivatives will swamp and wreck the FIRE Economy, taking the P/C Economy down with it.
I got into the topic with GaveKal CEO Louis-Vincent Gave on Sunday (interview here). His case for deflation in Europe is well articulated and specific: run-away asset price deflation happens because there is no euro bond market like the US and Japan have dollar and yen bond markets, each connected to a national central bank. The euro is a multinational political animal, with no centralized means to inflate.
The euro's lack of a euro bond market was first pointed out to us in our interview with Jamie Galbraith (JK's son) earlier this year when we were asking victims of various interviews: "What sort of international monetary regime after this one turns turtle?" It was one of those slap-your-forehead moments we hope to experience at least once in each interview we conduct. Jamie said a multilateral dollar-yen-euro regime depends on the development a euro bond market— so don't hold your breath.
The Road to Inflation
The inflation versus deflation debate was re-ignited by the Fed's 50 basis point rate shock therapy last week. Readers of pundits in the deflation camp demanded to know, "The long awaited credit meltdown is here. Where's the deflation? Gold and oil are going through the roof!"
Hudson’s prediction of the decline of the FIRE Economy is more or less a traditional Marxist one, that total interest payments eventually exceed the economy’s debt carrying capacity. At some point there’s a "break in the chain of payments," and the system collapses. Preventing such a break is what the Fed has been up to for the past few weeks, and the Bank of England is still doing for Barclays and other banks today.
No one knows whether the FIRE Economy is doomed or not. But its imminent demise has been prematurely announced many times over the past 20 years. I heard similar arguments from Marxist economics professors in college in the early 1980s. Now you can hear them from Libertarians, too.
Our Red Pill conclusion is that to keep the FIRE Economy running until the Next Bubbles get going, the Fed is willing to risk inflation in the P/C Economy, thus the 50 basis point cut while inflation is at multi-year highs and the dollar at multi-year lows. A bit of extra heat from the 1/10th HP heater is a necessary cost of preserving the 400 HP engine; once the FIRE Economy is firing on all cylinders again, P/C Economy inflation can be brought back under control. And, in the unlikely case that the FIRE Economy fails, expect massive capital outflows, a collapsing dollar and inflation as Mexico experienced in the late 1980s.
Either way, we don't see wage and goods price deflation in our future.
M O R E. . .
Normxxx
______________
The contents of any third-party letters/reports above do not necessarily reflect the opinions or viewpoint of normxxx. They are provided for informational/educational purposes only.
The content of any message or post by normxxx anywhere on this site is not to be construed as constituting market or investment advice. Such is intended for educational purposes only. Individuals should always consult with their own advisors for specific investment advice.
Friday, September 28, 2007
Has the Fed Lost Control Over Money?
Has the Fed Lost Control Over Money? [¹]
Or, a short primer on money and banking
By Gary North | 27 September 2007
In my previous article, "How Bernanke Snookered Us All," I made the case that during a one-month period, mid-August to mid-September, 2007, the Federal Reserve System deflated the adjusted monetary base. As with Austrian economists generally, I define "inflation" as "an increase of the money supply." [[But see also click.: normxxx]] I define "deflation" as "a decrease in the money supply." [[But see also click.: normxxx]] The adjusted monetary base (AMB) [[See also click.: normxxx]] is the only monetary aggregate that the FED controls directly. I referred readers to the chart and table provided by the Federal Reserve Bank of St. Louis which tracks this statistic. I do so again.
I said that this decrease in the monetary base was significant because this was during a period in which the Federal Open Market Committee (FOMC) of the Federal Reserve System was actively intervening in the market known as the Federal Funds Rate, i.e., overnight loans between banks, from banks to other banks. This rate had been exceeding the target rate of 5.25% for over two months. The FED normally intervened once a day to bring this rate back to about 5.25%. I offered a link to a page where anyone may see the daily rate in the FedFunds market: high, actual, and the FOMC's target rate. Here it is.
So far, we know two facts: (1) during the month leading up to the September 18 announcement by the FED of a reduction in the target rate for overnight bank loans to 4.75%, the FOMC was reducing the one monetary aggregate that it controls directly; (2) the FOMC was actively intervening daily to reduce the FedFunds rate to 5.25%[!?!]
My conclusion: the FED was buying repos from the banking system (inflationary— more money in circulation) while selling other assets (deflationary— less money in circulation). The FOMC sold more assets than it bought during this one-month period, which is the only way the adjusted monetary base could fall.
Are you with me so far?
I could be wrong about the FED's buy-and-sell techniques of this process. I am always open to suggestions. If someone can show me from the statistics how the adjusted monetary base could fall during a period in which the FOMC was actively intervening to push the interday FedFunds rate back to 5.25%, I want to hear it. I will certainly consider it. But I do not see how I can be wrong about the overall effect of this process: more FOMC sales of assets than purchases.
The adjusted monetary base fell. If the FOMC [[had: normxxx]] increased its [net] purchases of assets in this period, this [[would: normxxx]] indicates that the FOMC has lost control over the monetary base. [[[Because] : normxxx]]The base went down, contrary to the action that traditional central bank theory says must raise it: net purchases of assets. If the base fell while net monetary base assets (Federal Reserve credit) increased, this surely calls for an explanation. I am open to suggestions.
There is a second question: "Can the FOMC continue to do this, i.e., lower the adjusted monetary base while also keeping the Fedfunds rate to 4.75?" My guess is that it cannot— not for long, anyway. But that is a guess. The FOMC did it for a month.
I made this comment with respect to long-term FOMC policy:
I do not see how I could have been more clear. I did NOT say that the FOMC is deflating long-term. It is disinflating, compared to what the FOMC had done under Greenspan.
Fractional Reserves
One criticism I received from more than one source was this: the banking system can create credit, which is money, independent of the Federal Reserve System's monetary base.
At this point, the critics are breaking with what money and banking textbook authors have written about central banking for a century. Let me briefly review the argument of all economists— Austrian, Keynesian, Chicago School, and supply-side.
The central bank creates money when it purchases assets— any assets— for its account. It spends this new money into circulation when it buys an asset. This new money is deposited automatically in the asset-seller's account in a commercial bank. The fractional reserve process then takes over. This new money is used by the bank to make loans. The banks of the borrowers do the same, setting aside the required non-interest-bearing reserves with the FED. [[That is, the borrowers deposit the 'new' loan money into their own banks, and then their banks can lend out this money, less a small amount set asided as a required reserve, and so on, almost ad infinitum— this is known as "fractional reserve banking": normxxx]] When the process [eventually] ceases, the [[sum of all of the: normxxx]] reserves deposited with the FED [must] equal the initial purchase of assets by the FED. This is the standard textbook account.
Let us get this clear: the basis of all new credit created by the commercial banking system is the new money issued by the central bank.
In textbooks on money and banking, this process is described by the use of a conceptual tool called a T-account. Step by step, the author shows how the initial deposit of a check in a bank leads to the creation of new credit. The FED makes this initial deposit.
The best textbook I have seen on this process was written by Murray Rothbard: The Mystery of Banking (1983). You can download it for free here.
There are newsletter writers who argue that the banking system as a whole can create credit independently of an addition of Federal Reserve fiat money, which is often called high-powered money. I am surely willing to consider such an argument. What I need is evidence. I need to be shown how the commercial banking system as a whole can issue credit in a form that is not regulated by the central bank's legal reserve ratio.
As evidence, I would like a reference to some position paper issued by the FED which explains this. Also acceptable: a reference to a textbook or an academic journal that shows how the traditional textbook discussion of reserve requirements is incorrect.
Anyone who argues that fractional reserve banks can create credit that is not under the law regarding reserve requirements is making a very remarkable argument. For one thing, he is making it difficult to understand why the federal funds loan market even exists. The FedFunds market is universally recognized as a market for a bank that has temporarily exceeded its reserve requirement for the creation of new loans (credit) to meet this requirement by borrowing from another bank. Here is the description provided by the Federal Reserve Bank of New York.
Are bankers irrational? No. Are they in the habit of giving away money to other bankers? No. Then why does any bank borrow overnight money in the FedFunds market? The universal answer is: "To meet its reserve requirements for the day." If this answer is incorrect, then he who argues that the banking system can issue more credit than is allowed by the FED needs to show why this traditional argument is incorrect.
If the monetary base does not set the limit for bank credit, then he who argues this way needs to show why the entire academic field of money and banking has been wrong for over a century. He has to show that Murray Rothbard ignored something fundamental when he wrote The Mystery of Banking and his earlier book, Because, if the private commercial banks can create credit— money— independent of the government-licensed monopoly of the national central bank, then government is not the culprit that has destroyed our money; commercial banks are doing this all on their own.
You can download Rothbard's other book, which I regard as the best introduction to monetary theory despite being short, free of charge.
There are lots of things about money and banking that I do not understand. But I always thought I understood this: a central bank controls a nation's money supply by controlling (1) the reserve ratio and (2) the monetary base. Anyone who argues that commercial banks can and do issue credit independently of these two restraints is arguing that traditional monetary theory is incorrect. Such an argument requires considerable evidence.
Again, I am not saying that such evidence does not exist. I am saying that, so far, I have not seen anyone present it, especially those analysts who say that the commercial banking system, as a system, can do this any time it wants.
The bankers always want to maximize their revenues. They do this by creating credit, which is based on their banks' deposits. They do this at all times. They do not leave a penny on the books in a deposit that is not lent out at all times. Bank credit is always maximized.
Remember this: bank credit is money. Whatever a bank lends is money. This money buys things, which is why borrowers borrow it. They repay in money. Bankers want to be repaid in money. Credit is issued in the form of entries into borrowers' accounts. There is no bank credit that is not in the form of a deposit in a bank account. So, if anyone is increasing the supply of credit, this credit is in the form of an entry into a bank account. Bank accounts are regulated by the FED reserve requirements.
What we need to understand from those analysts who argue that the monetary base does not set monetary policy for the nation is exactly how the commercial banking system in the aggregate can issue credit independently of the FED's monetary base and its reserve requirements (which rarely change).
Is this too much to ask? So, you had better ask it. If someone tells you that the FED has lost control over the monetary system, and that banks can issue credit independently of the FED, ask him to explain why the standard textbook account is wrong, why T-account analysis is wrong, and how on earth Murray Rothbard got it wrong. The person who shows this may even win the Nobel Prize in economics, which is now over a million dollars. It seems like easy money to me for someone who argues that bank credit is independent of deposits in bank accounts.
Why M-3 Was Always Worthless
In my previous report, I wrote this about M-3.
The main purpose of following monetary statistics is to estimate what effect this will have on two things: (1) the price level; and, (2) the business cycle. Point #1 raises the question: Which statistics of prices?
The theoretical question of constructing a price index is amazingly complex. The best book on the question of price indexes was written in 1950 by economist Oskar Morgenstern, On the Accuracy of Economic Observations. Morgenstern was one of the few men smart enough to be invited by Ludwig von Mises to attend his private seminars in Austria. There is a good presentation of the implications of this book is posted on the Mises Institute's site.
I use the Median CPI figures— and other figures— to see the trend of past prices. I want to have some sense of how rapidly prices are trending upward. The statistics of the Median CPI go back 40 years. They are posted here (this week, anyway; they constantly change its address, which is very annoying).
I update the link whenever the Cleveland FED updates it. It is always on-line at my free department, "Price Indexes" (U.S.A.), here.
I have subscribers who tell me in no uncertain terms that all consumer price index statistics are fake. My response: as long as they are consistently fake, I can still use them to see the trend of prices. Only when the statisticians change their assumptions do the statistics become useless for assessing past periods that were not updated in terms of the revised assumptions. Even jiggered figures are useful if the statisticians retroactively revise previous figures. I can still see the trend.
Conclusion
I maintain that a nation's central bank controls the nation's money supply. It does so with two tools: (1) the legal reserve requirement, and (2) the purchase (inflationary) or sale (deflationary) of assets in its possession— the monetary base.
If someone says that a central bank does not control the nation's money supply in this way, then he owes it to his readers to explain either: (1) other ways that the central bank controls money; or (2) the ways that the commercial banks escape the controls set by the central bank. Either of these assertions requires textbook or similar evidence: simply saying that the central bank has lost control does not prove that it in fact has lost control.
———————————————————————————————————————
[ Normxxx Here: What most people miss or forget is that there are four parts to the Quantity Theory of Money Equation.
[The mathematically challenged can skip to the text below at "This equation"]
In its modern form, the Quantity Theory builds upon the following definitional relationship.
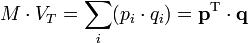
where
 is the total amount of money in circulation on average in an economy during the period, say a year.
 is the transactions' velocity of money, that is the average frequency across all transactions with which a unit of money is spent. It is derived from the other values in the equation.
 and
and  are the price and quantity of the i-th transaction.
 is a vector of the .
 is a vector of the .
Or, more simply:

where
V is the velocity of money in final expenditures.
Q is an index of the real value of final expenditures.
This equation, like the previous one, holds because V is constructed to make the two sides equal, although it is intended to represent the number of times a fixed amount of money changes hands in a given period (say, a year).
As an example, M might represent currency plus checking and savings-account money held by the public, Q real output with P the corresponding price level, and PQ the nominal (money) value of output. In one empirical formulation, velocity was defined as "the ratio of net national product in current prices to the money stock."
But, we ignore V at our peril, since this factor is as important as the quantity of money for inflation, and is crucial to understanding hyperinflation. Just because it is constructed by economists from the other elements of the equation doesn't mean it is not a real variable in the economy— it is calculated because there are (conveniently?) no direct means of measuring it. And no known way to control it independently of money supply.
To better understand V and why it changes as it does, there is no better article than Paul Tustain's "Hyperinflation: Creating Repulsive Money."
Next, there is the factor of "virtual" money. "Virtual" money (aka "paper" money, but not to be confused with Federal Reserve Notes) is what a thing (say, a stock or a derivative or a house) is measured in. It is not "real" because it does not represent any intrinsic value of the thing— it is usually set by so-called "market" transactions (i.e., recent purchases and sales of like things). In this sense, we can see that, e.g., gold has no 'intrinsic' value either— only a "market" value. We can at best argue that gold has been more stable than the dollar in price (what other things one can obtain/"buy" with it) over a large number of years. But if all (or even most) of the owners of gold decided to sell it at the same time, one fine day, its price would rapidly diminish towards zero, lacking an infinitely "liquid" market.
Thus, the amount of virtual money represented by all of the things of value (not necessarily only goods) in an economy, may be many, many times the (adjusted) monetary base (ABM). Virtual money is constantly being created and destroyed. When a stock goes up by one dollar, the total virtual money created is the stock's number of shares times the one dollar; and conversely, if it goes down, a like amount of virtual money can be said to be destroyed. This is true of housing; if the value of the most recent sales of like houses in my neighborhood goes down by $50,000, then I assume I have lost $50,000. That is because the instant I purchased my home, its value became virtual (it was real only at the point of transaction). What happened to the vanishing $50,000? It is held by the last seller of my house (assuming my house is now worth $50,000 less than when I purchased it)— or, if it is only $50,000 less than the last time I estimated its value, it never existed as real money in the system anyway, and so vanishes without a trace, like most dreams— all I can look forward to is realizing the virtual value of my house at any given time.
The Fed has precious little control of V, and absolutely no control of the virtual money supply.
But does the virtual money supply influence prices and inflation/deflation? Yes, of course, but being an imaginary quantity it can do so only indirectly through its influence on the psychology of economic person (aka, 'economic man').
First, it is obvious that having a virtual price for a thing allows one to transact in terms of an increase or decrease from that relative virtual price, which is far easier than trying to establish a value where none is known. So, it greatly diminishes price fluctuations and minimizes the possibility of 'wild bargains' and equally wild 'paper' losses (what one could have gotten for the thing less what one actually got). In the 'olden days', the value of a thing was generally somewhere around the minimum price a seller was prepared to part with it for, and the maximum price that a purchaser felt the thing was worth to him (or her). Such transactions often consumed the greater part of a day (or even several days for 'big ticket' items).
Second, virtual money value is the crucial factor in the "wealth effect"— how "rich" one tends to feel. And the "wealth effect" is a crucial factor in our propensity to spend (or save)— V, again. Moreover, since the wealth effect is psychological, it partly depends on the type of things one has and our personal or learned experience in converting such things into money. For most people, up until recently, a $500,000 house seemed a good bit more 'real' than an equal amount of stock, and probably contributed more to their feelings of wealth. Too, one can easily see how the current generation is far readier to equate their virtual worth with real money— as opposed to the post Great Depression generation, for example.
Lastly, There Is The Magic Of Derivatives, Or, How To Make Money Out Of Thin Air
We all live in the small town of X, Tomm, Dikk, Harrry, and I. Everybody knows that our word is as good as any bond. So, on Tuesday, thinking I might go to Big City, I borrow $10 from Tomm, giving him an IOU in exchange. On Wednesday, Dikk borrows the $10 from me (obviously, before I can spend it) and gives me an IOU for it. Then Harrry borrows the $10 from Dikk in exchange for an IOU. Now there are $30 of IOUs and one $10 bill in circulation— $40 where before there had only been the one $10 bill. Tomm, Dikk, Harrry, and I are not banks and pay no heed to the CB, much less pay any "fractional reserves," but we have just upped our local money supply by 300%!
Now this is just penney ante and is not likely to shake up the financial structure much. But when banks (and others) 'issue' derivatives, promising to pay money based on the outcome of some future event (like a mortgage being paid back)— but not strictly money nor a loan, and so completely outside of the Federal Reserve or any CB System, it explains how the world 'money supply' can be increased by over 40 times (not three times as in our penney ante example). In most cases, these derivatives can be used just like money (or, at least until the s--- hits the fan).
Tomm, Dikk, Harrry, and I can use those IOUs freely in lieu of cash, as long as we stay in X (where everyone knows us and is willing to take the IOUs). But, if I get run over by a horse some day, and die intestate, Tomm may be a long time in getting his $10 back, since neither Dikk nor Harrry owe him anything; although Dikk owes $10 to my estate, and Tomm can file a claim against my estate, assuming there is anything left after burial expenses.
———————————————————————————————————————
Now all I have left to do is tie this all together, but I'll leave that for another day. normxxx
———————————————————————————————————————
A postscript from Hussman's comments (see Reference): On Thursday, September 27th, the Federal Reserve entered into $6 billion in 14 day repos and $20 billion in 7 day repos. It also rolled over two small, shorter-term repos from earlier in the week that will roll over again on Monday— probably at least $10 billion, with a weekly total of about $30 billion by Thursday October 4th, to extend other repos that come due at that time. As of last week, the total amount of Fed repurchases outstanding is $44.75 billion. This is close to the total quantity of reserves in the U.S. banking system (which includes these repo proceeds). Meanwhile, total borrowings of depository institutions from the Fed— the much vaunted "liquidity" lent by the Fed at the Discount Rate— dropped from $2.4 billion to just $306 million last week, which is about the norm of recent years.
In short, next to nothing is actually lent through the discount window. Meanwhile, the Fed's open market operations are not injections of new liquidity, but a continuous rollover that finances a stable level of reserves, at a level that is negligible in relation to $6.3 trillion in total bank loans. If investors want to believe the superstition that Fed actions have anything but psychological effect, they should at least be prepared to demonstrate a specific mechanism by which observable FOMC operations exert that effect. It certainly is not through meaningful "injections of liquidity" into the banking system.
REFERENCE:
To See How Little The Fed Does Actually Control, See Hussman: Show Me The Money!
Remarkably, while arguing different aspects of the same facts and coming to somewhat different conclusions, Gary North and John Hussman are NOT in any dispute on the fundamental facts or issues, nor could they be.
Normxxx
______________
The contents of any third-party letters/reports above do not necessarily reflect the opinions or viewpoint of normxxx. They are provided for informational/educational purposes only.
The content of any message or post by normxxx anywhere on this site is not to be construed as constituting market or investment advice. Such is intended for educational purposes only. Individuals should always consult with their own advisors for specific investment advice.
Or, a short primer on money and banking
By Gary North | 27 September 2007
In my previous article, "How Bernanke Snookered Us All," I made the case that during a one-month period, mid-August to mid-September, 2007, the Federal Reserve System deflated the adjusted monetary base. As with Austrian economists generally, I define "inflation" as "an increase of the money supply." [[But see also click.: normxxx]] I define "deflation" as "a decrease in the money supply." [[But see also click.: normxxx]] The adjusted monetary base (AMB) [[See also click.: normxxx]] is the only monetary aggregate that the FED controls directly. I referred readers to the chart and table provided by the Federal Reserve Bank of St. Louis which tracks this statistic. I do so again.
I said that this decrease in the monetary base was significant because this was during a period in which the Federal Open Market Committee (FOMC) of the Federal Reserve System was actively intervening in the market known as the Federal Funds Rate, i.e., overnight loans between banks, from banks to other banks. This rate had been exceeding the target rate of 5.25% for over two months. The FED normally intervened once a day to bring this rate back to about 5.25%. I offered a link to a page where anyone may see the daily rate in the FedFunds market: high, actual, and the FOMC's target rate. Here it is.
So far, we know two facts: (1) during the month leading up to the September 18 announcement by the FED of a reduction in the target rate for overnight bank loans to 4.75%, the FOMC was reducing the one monetary aggregate that it controls directly; (2) the FOMC was actively intervening daily to reduce the FedFunds rate to 5.25%[!?!]
- [ Normxxx Here: But see reference below. ]
My conclusion: the FED was buying repos from the banking system (inflationary— more money in circulation) while selling other assets (deflationary— less money in circulation). The FOMC sold more assets than it bought during this one-month period, which is the only way the adjusted monetary base could fall.
Are you with me so far?
I could be wrong about the FED's buy-and-sell techniques of this process. I am always open to suggestions. If someone can show me from the statistics how the adjusted monetary base could fall during a period in which the FOMC was actively intervening to push the interday FedFunds rate back to 5.25%, I want to hear it. I will certainly consider it. But I do not see how I can be wrong about the overall effect of this process: more FOMC sales of assets than purchases.
The adjusted monetary base fell. If the FOMC [[had: normxxx]] increased its [net] purchases of assets in this period, this [[would: normxxx]] indicates that the FOMC has lost control over the monetary base. [[[Because] : normxxx]]The base went down, contrary to the action that traditional central bank theory says must raise it: net purchases of assets. If the base fell while net monetary base assets (Federal Reserve credit) increased, this surely calls for an explanation. I am open to suggestions.
There is a second question: "Can the FOMC continue to do this, i.e., lower the adjusted monetary base while also keeping the Fedfunds rate to 4.75?" My guess is that it cannot— not for long, anyway. But that is a guess. The FOMC did it for a month.
I made this comment with respect to long-term FOMC policy:
- The table at the bottom of the chart provides the important numbers: the rate of increase from various dates until now. From mid-September, 2006, to mid-September, 2007, the increase was 1.8% per annum. This is what it has been ever since Bernanke took over on February 1, 2006.
An increase of 1.8% is tight money policy by previous FED standards [[any time the rate of increase of AMB is below the rate of inflation, money policy is tight: normxxx]]. I have been hammering on this point for a year. The FED has dramatically reduced the rate of monetary inflation.
I do not see how I could have been more clear. I did NOT say that the FOMC is deflating long-term. It is disinflating, compared to what the FOMC had done under Greenspan.
Fractional Reserves
One criticism I received from more than one source was this: the banking system can create credit, which is money, independent of the Federal Reserve System's monetary base.
At this point, the critics are breaking with what money and banking textbook authors have written about central banking for a century. Let me briefly review the argument of all economists— Austrian, Keynesian, Chicago School, and supply-side.
The central bank creates money when it purchases assets— any assets— for its account. It spends this new money into circulation when it buys an asset. This new money is deposited automatically in the asset-seller's account in a commercial bank. The fractional reserve process then takes over. This new money is used by the bank to make loans. The banks of the borrowers do the same, setting aside the required non-interest-bearing reserves with the FED. [[That is, the borrowers deposit the 'new' loan money into their own banks, and then their banks can lend out this money, less a small amount set asided as a required reserve, and so on, almost ad infinitum— this is known as "fractional reserve banking": normxxx]] When the process [eventually] ceases, the [[sum of all of the: normxxx]] reserves deposited with the FED [must] equal the initial purchase of assets by the FED. This is the standard textbook account.
Let us get this clear: the basis of all new credit created by the commercial banking system is the new money issued by the central bank.
In textbooks on money and banking, this process is described by the use of a conceptual tool called a T-account. Step by step, the author shows how the initial deposit of a check in a bank leads to the creation of new credit. The FED makes this initial deposit.
The best textbook I have seen on this process was written by Murray Rothbard: The Mystery of Banking (1983). You can download it for free here.
There are newsletter writers who argue that the banking system as a whole can create credit independently of an addition of Federal Reserve fiat money, which is often called high-powered money. I am surely willing to consider such an argument. What I need is evidence. I need to be shown how the commercial banking system as a whole can issue credit in a form that is not regulated by the central bank's legal reserve ratio.
As evidence, I would like a reference to some position paper issued by the FED which explains this. Also acceptable: a reference to a textbook or an academic journal that shows how the traditional textbook discussion of reserve requirements is incorrect.
Anyone who argues that fractional reserve banks can create credit that is not under the law regarding reserve requirements is making a very remarkable argument. For one thing, he is making it difficult to understand why the federal funds loan market even exists. The FedFunds market is universally recognized as a market for a bank that has temporarily exceeded its reserve requirement for the creation of new loans (credit) to meet this requirement by borrowing from another bank. Here is the description provided by the Federal Reserve Bank of New York.
- Fed funds are unsecured loans of reserve balances at Federal Reserve Banks between depository institutions. Banks keep reserve balances at the Federal Reserve Banks to meet their reserve requirements and to clear financial transactions. Transactions in the fed funds market enable depository institutions with reserve balances in excess of reserve requirements to lend them, or "sell" as it is called by market participants, to institutions with reserve deficiencies. Fed funds transactions neither increase nor decrease total bank reserves. Instead, they redistribute bank reserves and enable otherwise idle funds to yield a return. Technical details on fed funds are described in Regulation D.
Are bankers irrational? No. Are they in the habit of giving away money to other bankers? No. Then why does any bank borrow overnight money in the FedFunds market? The universal answer is: "To meet its reserve requirements for the day." If this answer is incorrect, then he who argues that the banking system can issue more credit than is allowed by the FED needs to show why this traditional argument is incorrect.
If the monetary base does not set the limit for bank credit, then he who argues this way needs to show why the entire academic field of money and banking has been wrong for over a century. He has to show that Murray Rothbard ignored something fundamental when he wrote The Mystery of Banking and his earlier book, Because, if the private commercial banks can create credit— money— independent of the government-licensed monopoly of the national central bank, then government is not the culprit that has destroyed our money; commercial banks are doing this all on their own.
You can download Rothbard's other book, which I regard as the best introduction to monetary theory despite being short, free of charge.
There are lots of things about money and banking that I do not understand. But I always thought I understood this: a central bank controls a nation's money supply by controlling (1) the reserve ratio and (2) the monetary base. Anyone who argues that commercial banks can and do issue credit independently of these two restraints is arguing that traditional monetary theory is incorrect. Such an argument requires considerable evidence.
Again, I am not saying that such evidence does not exist. I am saying that, so far, I have not seen anyone present it, especially those analysts who say that the commercial banking system, as a system, can do this any time it wants.
The bankers always want to maximize their revenues. They do this by creating credit, which is based on their banks' deposits. They do this at all times. They do not leave a penny on the books in a deposit that is not lent out at all times. Bank credit is always maximized.
Remember this: bank credit is money. Whatever a bank lends is money. This money buys things, which is why borrowers borrow it. They repay in money. Bankers want to be repaid in money. Credit is issued in the form of entries into borrowers' accounts. There is no bank credit that is not in the form of a deposit in a bank account. So, if anyone is increasing the supply of credit, this credit is in the form of an entry into a bank account. Bank accounts are regulated by the FED reserve requirements.
What we need to understand from those analysts who argue that the monetary base does not set monetary policy for the nation is exactly how the commercial banking system in the aggregate can issue credit independently of the FED's monetary base and its reserve requirements (which rarely change).
Is this too much to ask? So, you had better ask it. If someone tells you that the FED has lost control over the monetary system, and that banks can issue credit independently of the FED, ask him to explain why the standard textbook account is wrong, why T-account analysis is wrong, and how on earth Murray Rothbard got it wrong. The person who shows this may even win the Nobel Prize in economics, which is now over a million dollars. It seems like easy money to me for someone who argues that bank credit is independent of deposits in bank accounts.
Why M-3 Was Always Worthless
In my previous report, I wrote this about M-3.
- I don't think my message has penetrated the thinking of most hard-money contrarians. They keep citing M-3, which was canceled by the FED a year ago, and which was always the most misleading of all monetary statistics. Year after year, the M-3 statistic was four times higher than the CPI. The M-3 statistic was worthless from day one. Anyone who used it to make investments lost most (or all) of his money. I have written a report on this, which provides the evidence: "Monetary Statistics."
The main purpose of following monetary statistics is to estimate what effect this will have on two things: (1) the price level; and, (2) the business cycle. Point #1 raises the question: Which statistics of prices?
The theoretical question of constructing a price index is amazingly complex. The best book on the question of price indexes was written in 1950 by economist Oskar Morgenstern, On the Accuracy of Economic Observations. Morgenstern was one of the few men smart enough to be invited by Ludwig von Mises to attend his private seminars in Austria. There is a good presentation of the implications of this book is posted on the Mises Institute's site.
I use the Median CPI figures— and other figures— to see the trend of past prices. I want to have some sense of how rapidly prices are trending upward. The statistics of the Median CPI go back 40 years. They are posted here (this week, anyway; they constantly change its address, which is very annoying).
I update the link whenever the Cleveland FED updates it. It is always on-line at my free department, "Price Indexes" (U.S.A.), here.
I have subscribers who tell me in no uncertain terms that all consumer price index statistics are fake. My response: as long as they are consistently fake, I can still use them to see the trend of prices. Only when the statisticians change their assumptions do the statistics become useless for assessing past periods that were not updated in terms of the revised assumptions. Even jiggered figures are useful if the statisticians retroactively revise previous figures. I can still see the trend.
Conclusion
I maintain that a nation's central bank controls the nation's money supply. It does so with two tools: (1) the legal reserve requirement, and (2) the purchase (inflationary) or sale (deflationary) of assets in its possession— the monetary base.
If someone says that a central bank does not control the nation's money supply in this way, then he owes it to his readers to explain either: (1) other ways that the central bank controls money; or (2) the ways that the commercial banks escape the controls set by the central bank. Either of these assertions requires textbook or similar evidence: simply saying that the central bank has lost control does not prove that it in fact has lost control.
———————————————————————————————————————
[ Normxxx Here: What most people miss or forget is that there are four parts to the Quantity Theory of Money Equation.
[The mathematically challenged can skip to the text below at "This equation"]
In its modern form, the Quantity Theory builds upon the following definitional relationship.
where
is the total amount of money in circulation on average in an economy during the period, say a year. is the transactions' velocity of money, that is the average frequency across all transactions with which a unit of money is spent. It is derived from the other values in the equation. and are the price and quantity of the i-th transaction. is a vector of the . is a vector of the .Or, more simply:
where
V is the velocity of money in final expenditures.
Q is an index of the real value of final expenditures.
This equation, like the previous one, holds because V is constructed to make the two sides equal, although it is intended to represent the number of times a fixed amount of money changes hands in a given period (say, a year).
As an example, M might represent currency plus checking and savings-account money held by the public, Q real output with P the corresponding price level, and PQ the nominal (money) value of output. In one empirical formulation, velocity was defined as "the ratio of net national product in current prices to the money stock."
But, we ignore V at our peril, since this factor is as important as the quantity of money for inflation, and is crucial to understanding hyperinflation. Just because it is constructed by economists from the other elements of the equation doesn't mean it is not a real variable in the economy— it is calculated because there are (conveniently?) no direct means of measuring it. And no known way to control it independently of money supply.
To better understand V and why it changes as it does, there is no better article than Paul Tustain's "Hyperinflation: Creating Repulsive Money."
Next, there is the factor of "virtual" money. "Virtual" money (aka "paper" money, but not to be confused with Federal Reserve Notes) is what a thing (say, a stock or a derivative or a house) is measured in. It is not "real" because it does not represent any intrinsic value of the thing— it is usually set by so-called "market" transactions (i.e., recent purchases and sales of like things). In this sense, we can see that, e.g., gold has no 'intrinsic' value either— only a "market" value. We can at best argue that gold has been more stable than the dollar in price (what other things one can obtain/"buy" with it) over a large number of years. But if all (or even most) of the owners of gold decided to sell it at the same time, one fine day, its price would rapidly diminish towards zero, lacking an infinitely "liquid" market.
Thus, the amount of virtual money represented by all of the things of value (not necessarily only goods) in an economy, may be many, many times the (adjusted) monetary base (ABM). Virtual money is constantly being created and destroyed. When a stock goes up by one dollar, the total virtual money created is the stock's number of shares times the one dollar; and conversely, if it goes down, a like amount of virtual money can be said to be destroyed. This is true of housing; if the value of the most recent sales of like houses in my neighborhood goes down by $50,000, then I assume I have lost $50,000. That is because the instant I purchased my home, its value became virtual (it was real only at the point of transaction). What happened to the vanishing $50,000? It is held by the last seller of my house (assuming my house is now worth $50,000 less than when I purchased it)— or, if it is only $50,000 less than the last time I estimated its value, it never existed as real money in the system anyway, and so vanishes without a trace, like most dreams— all I can look forward to is realizing the virtual value of my house at any given time.
The Fed has precious little control of V, and absolutely no control of the virtual money supply.
But does the virtual money supply influence prices and inflation/deflation? Yes, of course, but being an imaginary quantity it can do so only indirectly through its influence on the psychology of economic person (aka, 'economic man').
First, it is obvious that having a virtual price for a thing allows one to transact in terms of an increase or decrease from that relative virtual price, which is far easier than trying to establish a value where none is known. So, it greatly diminishes price fluctuations and minimizes the possibility of 'wild bargains' and equally wild 'paper' losses (what one could have gotten for the thing less what one actually got). In the 'olden days', the value of a thing was generally somewhere around the minimum price a seller was prepared to part with it for, and the maximum price that a purchaser felt the thing was worth to him (or her). Such transactions often consumed the greater part of a day (or even several days for 'big ticket' items).
Second, virtual money value is the crucial factor in the "wealth effect"— how "rich" one tends to feel. And the "wealth effect" is a crucial factor in our propensity to spend (or save)— V, again. Moreover, since the wealth effect is psychological, it partly depends on the type of things one has and our personal or learned experience in converting such things into money. For most people, up until recently, a $500,000 house seemed a good bit more 'real' than an equal amount of stock, and probably contributed more to their feelings of wealth. Too, one can easily see how the current generation is far readier to equate their virtual worth with real money— as opposed to the post Great Depression generation, for example.
Lastly, There Is The Magic Of Derivatives, Or, How To Make Money Out Of Thin Air
We all live in the small town of X, Tomm, Dikk, Harrry, and I. Everybody knows that our word is as good as any bond. So, on Tuesday, thinking I might go to Big City, I borrow $10 from Tomm, giving him an IOU in exchange. On Wednesday, Dikk borrows the $10 from me (obviously, before I can spend it) and gives me an IOU for it. Then Harrry borrows the $10 from Dikk in exchange for an IOU. Now there are $30 of IOUs and one $10 bill in circulation— $40 where before there had only been the one $10 bill. Tomm, Dikk, Harrry, and I are not banks and pay no heed to the CB, much less pay any "fractional reserves," but we have just upped our local money supply by 300%!
Now this is just penney ante and is not likely to shake up the financial structure much. But when banks (and others) 'issue' derivatives, promising to pay money based on the outcome of some future event (like a mortgage being paid back)— but not strictly money nor a loan, and so completely outside of the Federal Reserve or any CB System, it explains how the world 'money supply' can be increased by over 40 times (not three times as in our penney ante example). In most cases, these derivatives can be used just like money (or, at least until the s--- hits the fan).
Tomm, Dikk, Harrry, and I can use those IOUs freely in lieu of cash, as long as we stay in X (where everyone knows us and is willing to take the IOUs). But, if I get run over by a horse some day, and die intestate, Tomm may be a long time in getting his $10 back, since neither Dikk nor Harrry owe him anything; although Dikk owes $10 to my estate, and Tomm can file a claim against my estate, assuming there is anything left after burial expenses.
———————————————————————————————————————
Now all I have left to do is tie this all together, but I'll leave that for another day. normxxx
———————————————————————————————————————
A postscript from Hussman's comments (see Reference): On Thursday, September 27th, the Federal Reserve entered into $6 billion in 14 day repos and $20 billion in 7 day repos. It also rolled over two small, shorter-term repos from earlier in the week that will roll over again on Monday— probably at least $10 billion, with a weekly total of about $30 billion by Thursday October 4th, to extend other repos that come due at that time. As of last week, the total amount of Fed repurchases outstanding is $44.75 billion. This is close to the total quantity of reserves in the U.S. banking system (which includes these repo proceeds). Meanwhile, total borrowings of depository institutions from the Fed— the much vaunted "liquidity" lent by the Fed at the Discount Rate— dropped from $2.4 billion to just $306 million last week, which is about the norm of recent years.
In short, next to nothing is actually lent through the discount window. Meanwhile, the Fed's open market operations are not injections of new liquidity, but a continuous rollover that finances a stable level of reserves, at a level that is negligible in relation to $6.3 trillion in total bank loans. If investors want to believe the superstition that Fed actions have anything but psychological effect, they should at least be prepared to demonstrate a specific mechanism by which observable FOMC operations exert that effect. It certainly is not through meaningful "injections of liquidity" into the banking system.
REFERENCE:
To See How Little The Fed Does Actually Control, See Hussman: Show Me The Money!
Remarkably, while arguing different aspects of the same facts and coming to somewhat different conclusions, Gary North and John Hussman are NOT in any dispute on the fundamental facts or issues, nor could they be.
Normxxx
______________
The contents of any third-party letters/reports above do not necessarily reflect the opinions or viewpoint of normxxx. They are provided for informational/educational purposes only.
The content of any message or post by normxxx anywhere on this site is not to be construed as constituting market or investment advice. Such is intended for educational purposes only. Individuals should always consult with their own advisors for specific investment advice.
Thursday, September 27, 2007
The Greater Depression
The Greater Depression— UPDATE [¹]
By Doug Casey | 27 September 2007
Let me cover the big picture. I do think we're approaching the end of the world as we know it...[[aka, TEOTWAWKI: normxxx]] I think there is such thing as the business cycle. It exists. And we've had the longest expansion— and the strongest expansion— in the world history. But we're at the end of a 25-year boom. It's gone on more than a full generation now. And I'll tell you how it's going to end: It's going to end with a depression, and not just a depression; not just another Great Depression; it's going to be the Greater Depression.
What's a depression, incidentally? It's a period of time when distortions and misallocations of capital are liquidated [[wiped out!: normxxx]]; that's called a depression. Over the last 25 years, [increasing] distortions and misallocations of capital have produced an artificial boom. But when these distortions and misallocations of capital are liquidated, we'll get a depression.
Another general definition of a depression is this: a period of time when most people's standard of living goes down significantly. Now, for the long run, there's no question in my mind the standard of living of everybody on earth is going to go up immensely over the next hundred years. Immensely. But that doesn't mean that we're not going to have setbacks, and I think we're looking at one: A severe standard of living drop. So the economic picture [just ahead] is not going to be good...
So what should you be doing about all this? I suggest you really internationalize yourself. I think what you ought to have is your citizenship in one country, your bank account in another country, your investments in a third, and live in a fourth. You've got to internationalize yourself. Most people out there are like medieval serfs, psychologically and physically: they're born some place, they don't go very far from it and that's where they die, and they're going to get exactly what they deserve. Well, you can't be that way. I think you ought to treat the world as your oyster.
What am I doing about this? I've been all over the world. I guess I've lived in 12 countries now. And out of 175, I've been to most of them, numerous times actually. What am I doing, where do I want to go, where am I living?
Well, in New Zealand. I went there a few years ago for the polo, actually, and the reason was that playing polo there was about 10% what it cost me in Palm Beach, and I liked it better. So we bought a lot of real estate. But since then, the currency has doubled and the real estate within that currency has doubled at least. So I'm getting out of New Zealand. Where am I going now? I'm going to Argentina.
And let me give you a tip, okay? Forget about Europe, it's going to become a petting zoo. It's like Disneyland with real stones instead of papier maché stones. I mean, Europe is on the slippery slope. I wouldn't touch Europe with a ten-foot pole. If this war with Islam gets out of control, Europe is going to be an epicenter. It's going to be a disaster. I'll tell you where you ought to look. Argentina is the place to be. It's the cheapest country in the world. It has low population, incredibly beautiful, the climate is great. One hundred years ago, it was in competition with the US for being the best place in the world and the richest place. But it went downhill radically, radically.
But let me tell you something. It's turning around I think. And what's going to happen is driven by the fact that everything in Argentina costs between 10% to 30% of what it costs in North America. That's correct. It's that cheap. It's free. It's free. It's free for us as North Americans. But the Europeans really think it's free with that strong Euro. So you're getting a massive immigration from rich Europeans that can see the handwriting on the wall and like it down there. And I really like it down there. It's just a great society, great society, great place to hang out, prices are right. I mean this can solve most of your investment problems right there, just by transplanting yourself, if you've got some capital. Furthermore, Argentina is going to be insolated from WWIII to a good extent.
Normxxx
______________
The contents of any third-party letters/reports above do not necessarily reflect the opinions or viewpoint of normxxx. They are provided for informational/educational purposes only.
The content of any message or post by normxxx anywhere on this site is not to be construed as constituting market or investment advice. Such is intended for educational purposes only. Individuals should always consult with their own advisors for specific investment advice.
The Downward Spiral Continues

Homebuilders: The Downward Spiral Continues [¹]
By Bank Credit Analyst | 27 September 2007
 Homebuilding stocks have been stuck in a freefall and a turnaround in coming quarters is unlikely. Heightened concern about sub-prime loan defaults remains a key ingredient to the bear market in both sub-prime and housing stocks. Notably, sub-prime relative performance, has led homebuilding stocks in the past decade, and the current message is still negative. Meanwhile, Lennar posted a massive third-quarter loss Tuesday, highlighting that the industry still has the ability to surprise on the downside. It will take a substantial drop in interest rates, house prices, or a combination of the two, to bolster affordability sufficiently to clear excess housing stock. The latter is unlikely with lenders still in the early stages of tightening standards on mortgage loans and a still high level of home sales relative to the housing stock. Thus, while the industry has already been through a dreadful year, it is too soon to attempt any bottom fishing.
Normxxx
______________
The contents of any third-party letters/reports above do not necessarily reflect the opinions or viewpoint of normxxx. They are provided for informational/educational purposes only.
The content of any message or post by normxxx anywhere on this site is not to be construed as constituting market or investment advice. Such is intended for educational purposes only. Individuals should always consult with their own advisors for specific investment advice.
Bloomberg: CPI Inflation Data is a "Lie"
Bloomberg: CPI Inflation Data is a "Lie" [¹]
By TheBigPicture | 27 September 2007

Click Here, or on the image, to see a larger, undistorted image.
~~~
Those of you who are fellow tri-state residents (NY, NJ, CT) will be as thrilled as I was that BLS shows transportation costs are declining; especially since the MTA (NY) said it will be increasing NYC subway fares .25 (12.5%) to to $2.25 per ride. Commuter railroad fares on both the Long Island Rail Road and Metro-North rail lines are rising 8% to close its budget gap.
This is now far, far beyond spin— its simply outright lying to present a version of reality that radically differs from the "Real" one (pun intended).
So why haven't we gotten a more realistic version of inflation— one that has a high correlation with the construct known as reality? Well, it would wreak havoc with GDP, and potentially, the stock market. An accurate cost of living increase— in theory, what CPI is supposed to measure— would’ve eradicated a whole lot of GDP gains over the past 5 years.
That "Real 'Real'" GDP figure— adjusted for 'true' CPI inflation, which was adjusted for ACTUAL inflation— would be far more in in line with the lack of growth in real income and ‘real’ jobs . . .
As reflected in the plummeting dollar, many of the gains of the past few years were purely inflation driven, nominal asset price increases— not real (after inflation) gains.
Source:
Rise and Be Counted
Willow Duttge
Portfolio, October 2007
http://www.portfolio.com/news-markets/national-news/portfolio/2007/09/17/Consumer-Price-Index
Download indicator.gif
CPI's Lie on Household Inflation Doesn't Wash
John F. Wasik
Bloomberg, September 24 2007
http://www.bloomberg.com/apps/news?pid=newsarchive&sid=a2SUCQ3Bslk0
John Williams'— The Real Stats— Using Pre-Clinton Formulations
SHADOW GOVERNMENT STATISTICS
Analysis Behind and Beyond Government Economic Reporting
Normxxx
______________
The contents of any third-party letters/reports above do not necessarily reflect the opinions or viewpoint of normxxx. They are provided for informational/educational purposes only.
The content of any message or post by normxxx anywhere on this site is not to be construed as constituting market or investment advice. Such is intended for educational purposes only. Individuals should always consult with their own advisors for specific investment advice.
By TheBigPicture | 27 September 2007

Click Here, or on the image, to see a larger, undistorted image.
- We have long railed against the absurdity of the CPI data. The ridiculous adjustments, the lack of correlation between CPI prices and reality, as well as the Fed focus on the core (inflation ex-inflation).
For the most part, the media has dutifully reported the nonsensical CPI data as if it were scripture. This drumbeat of criticism— both here and elsewhere— has begun to penetrate the MSM. We've seen a few critical columns over the past year or so. But I never expected to see this kind of critical reporting in a mainstream outlet: CPI's Lie on Household Inflation Doesn't Wash.
Perhaps the era of uncritical reporting is waning.
- "The U.S. consumer price index continues to be a testament to the art of economic spin.
Since wages, Social Security cost-of-living increases and some agency budgets are tied to it, the government has a vested interest in keeping it as low as possible.
Yet your real cost of living— what you keep after taxes, medical bills, college expenses and other household costs— is probably much higher than the 2 percent annual rate the government reported in July, showing a slight decline.
Millions are falling behind inflation because wage increases aren't keeping pace with the cost of medical care, lost employment benefits, homeownership expenses, energy and transportation.
And there's also a goliath looming in the U.S. economy that makes the government's consumer gauge more deceptive. Even with the stinging reality that housing values are dropping in many markets, homeownership costs such as taxes, maintenance and financing are still rising much faster than the index."
- • Since 2001, health premiums have risen 78%; Wages have gained 19% over the same period. CPI inflation measure? 17%.
• Housing is the single-largest expense for most Americans— as much as a third of total cash outlays. The Labor Department's Bureau of Labor Statistics only tracks "owner's equivalent rent" (OER). Housing costs/Owners’ Equivalent Rent is 23.158% of CPI.
• During the housing boom, OFHEO had housing prices increasing 13% per year; Non-government foundations had real estate taxes increasing about 6%; Over the same period, BLS measured ‘housing cost increases’ at 4%— about half of its actual price increases.
• Median real-estate taxes on owner-occupied housing went from $1,614 in 2005 to $1,742 in 2006, an increase of 7.93%. (That's more than double CPI inflation rate).Oh, and ‘Owners’ Equivalent Rent’ doesn’t account for real estate taxes.
~~~
Those of you who are fellow tri-state residents (NY, NJ, CT) will be as thrilled as I was that BLS shows transportation costs are declining; especially since the MTA (NY) said it will be increasing NYC subway fares .25 (12.5%) to to $2.25 per ride. Commuter railroad fares on both the Long Island Rail Road and Metro-North rail lines are rising 8% to close its budget gap.
This is now far, far beyond spin— its simply outright lying to present a version of reality that radically differs from the "Real" one (pun intended).
So why haven't we gotten a more realistic version of inflation— one that has a high correlation with the construct known as reality? Well, it would wreak havoc with GDP, and potentially, the stock market. An accurate cost of living increase— in theory, what CPI is supposed to measure— would’ve eradicated a whole lot of GDP gains over the past 5 years.
That "Real 'Real'" GDP figure— adjusted for 'true' CPI inflation, which was adjusted for ACTUAL inflation— would be far more in in line with the lack of growth in real income and ‘real’ jobs . . .
As reflected in the plummeting dollar, many of the gains of the past few years were purely inflation driven, nominal asset price increases— not real (after inflation) gains.
Source:
Rise and Be Counted
Willow Duttge
Portfolio, October 2007
http://www.portfolio.com/news-markets/national-news/portfolio/2007/09/17/Consumer-Price-Index
Download indicator.gif
CPI's Lie on Household Inflation Doesn't Wash
John F. Wasik
Bloomberg, September 24 2007
http://www.bloomberg.com/apps/news?pid=newsarchive&sid=a2SUCQ3Bslk0
John Williams'— The Real Stats— Using Pre-Clinton Formulations
SHADOW GOVERNMENT STATISTICS
Analysis Behind and Beyond Government Economic Reporting
Normxxx
______________
The contents of any third-party letters/reports above do not necessarily reflect the opinions or viewpoint of normxxx. They are provided for informational/educational purposes only.
The content of any message or post by normxxx anywhere on this site is not to be construed as constituting market or investment advice. Such is intended for educational purposes only. Individuals should always consult with their own advisors for specific investment advice.
Why The Fed "Panicked" ...
Subprime Panic Freezes $40 Billion of Canadian Commercial Paper [¹]
By Rob Delaney | 25 September 2007
Sept. 25 (Bloomberg)—
"We have 200 people to keep alive," Chief Executive Officer Gordon McCreary said in an interview in Toronto. "Our lifeline to getting critical materials to the north" was the C$43.8 million ($43.8 million) invested in commercial paper, he said.
The Canadian cash crunch that started with defaults on subprime mortgages in Southern California and Florida has hurt more than 25 companies that invested in commercial paper, including Sun-Times Media Group Inc. and Canada Post, the nation's mail service. Baffinland has 95 percent of its cash in Canadian commercial paper, debt that is due in 364 days or less.
Investors fled Canada's asset-backed commercial paper, paralyzing the C$40 billion market for debt that carried the highest credit ratings, after losses from home loans to people with poor credit histories roiled global credit markets.
Coventree Can't Pay
That left Baffinland and other investors in the lurch because 17 funds run by finance companies including Toronto— based Coventree Inc., Newshore Financial Corp. and Quanto Financial Corp., couldn't raise money to pay back lenders, according to ratings company DBRS Ltd.
Coventree managed C$16 billion in commercial paper funds with the highest ratings.
The funds run by companies such as Coventree paid interest of about 4.6 percent for 30 days, compared with three-month Canadian government bills that yielded 4.35 percent. The debt is backed by mortgages, corporate bonds, and car loans that typically yield as much as 1 percentage point more than commercial paper, according to Colin Kilgour, president of Connor Clark & Lunn Wholesale Finance, the structured credit and securitization unit of Connor Clark & Lunn Financial Group.
About 4 percent of Coventree's commercial paper was backed by subprime mortgages.
No commercial paper borrower had failed to pay on time in two decades and Toronto-based DBRS gave the securities its top rating of R-1. The funds also had backup lines of credit from banks should a market disruption shut down the market.
Canada's asset-backed commercial paper market doubled to C$120 billion since 2000, according to Moody's Investors Service in New York. Buyers snapped up the IOUs as government debt sales fell 60 percent to C$23.5 billion in the past decade after nine straight surpluses, according to the March budget.
`Concept of Risk'
"You can get what the bank pays you, which is not very much, or you can put it in asset-backed commercial paper, which have always been rated as high as you can get so there's never been any concept of risk," said Geoff Chater, a spokesman for Vancouver-based First Quantum Resources Minerals Ltd., a copper mining company operating in Africa.
First Quantum hasn't been repaid on C$7.5 million of debt issued by Coventree that matured on Aug. 14 and Aug. 15, he said. It had about 28 percent of its cash in commercial paper.
Six-Year Highs
Starting in July, growing defaults in U.S. home loans caused the cost of borrowing to increase for all but the most creditworthy companies. Rates on asset-backed commercial paper soared, rising to six-year highs in the U.S. as the three-month London interbank offered rate, or Libor, climbed to 5.82 percent from 5.35 percent. Libor is a benchmark for commercial paper rates.
Making matters worse banks, including Frankfurt-based Deutsche Bank AG and Barclays Bank Plc of London, refused to provide emergency financing. They said there was no market disruption because some of Canada's biggest commercial banks were able to refinance debt.
Investors began demanding yields of about 6.03 percent to own Coventree's commercial paper. On Aug. 13 the company said it couldn't find enough buyers to refinance C$950 million of short=term debt and its banks refused to provide emergency funds. Company spokesman Craig Armitage declined to comment.
"Anytime there's a reliance on short-term funding without specific alternative plans for liquidity, that's going to be suspect," said John Hollyer, principal at Valley Forge, Pennsylvania-based Vanguard Group Inc., which has $170 billion in money market funds under management. "That's the overriding lesson of what happened here."
Debt Extension
A group of 10 banks and pension funds agreed on Aug. 16 to convert C$35 billion of debt into notes maturing in as much as 10 years. Terms of the debt won't be released until mid-October, said Purdy Crawford, a lawyer at the Toronto firm Osler, Hoskin & Harcourt LLP who heads the group. Until then, investors won't know when they will get their money back, or whether they will be repaid in full.
Deutsche Bank spokesman Ted Meyer in New York declined to comment, as did Barclays spokesman Peter Truell, also in New York.
Companies invested in the debt in part because of the ratings from DBRS, formerly Dominion Bond Rating Service, said Robin Roopchan, director of investor relations at Ontario Power Generation in Toronto, which bought C$103 million of the securities, none of which has been repaid.
`Global Liquidity'
DBRS figured on banks providing funds, said Managing Director Huston Loke.
"We expected a combination of the market and liquidity providers would have carried investors through," Loke said in an interview. The disruption clause "took good care of the market for 18 years," he said.
DBRS said Sept. 12 it will change its rating rules and adopt a "global liquidity" standard to prevent debt getting the highest credit rating if banks can refuse to provide funding.
"The banks are saying there's no market disruption, and obviously there is a market disruption," said Troy Winsor, a spokesman for Redcorp Ventures Ltd., based in Vancouver.
Redcorp put 43 percent of its money in Coventree commercial paper on the advice of HSBC Canada, Winsor said. Redcorp is building a copper, zinc and lead mine in British Columbia.
Sharon Wilks, a spokeswoman in Toronto for HSBC Canada, a unit of HSBC Holdings Plc, Europe's biggest bank, declined to comment. HSBC is among the banks working on the debt plan.
`Driving On'
Canada Post had about 3.5 percent, or C$37.9 million, of its treasury investments in asset-backed commercial paper, according to John Caines, manager for media relations. The company is representing investors negotiating with the banks.
Sun-Times, the publisher of the Chicago Sun-Times newspaper formerly controlled by convicted felon Conrad Black, said it doesn't anticipate a "major capital loss" after two trusts failed to pay back C$48 million in commercial paper.
The company signed "standstill" agreements in August with both National Bank of Canada's Ironstone Trust and Coventree's Planet Trust to avoid taking legal action until Oct. 15, Sun— Times spokesman Tammy Chase said.
Baffinland bought commercial paper on the advice of Toronto-based Bank of Nova Scotia. McCreary wouldn't say how much interest he is now paying on the C$21 million credit line.
"We're driving on," McCreary said.
Normxxx
______________
The contents of any third-party letters/reports above do not necessarily reflect the opinions or viewpoint of normxxx. They are provided for informational/educational purposes only.
The content of any message or post by normxxx anywhere on this site is not to be construed as constituting market or investment advice. Such is intended for educational purposes only. Individuals should always consult with their own advisors for specific investment advice.
By Rob Delaney | 25 September 2007
Sept. 25 (Bloomberg)—
- On Baffin Island in the Arctic Circle, Baffinland Iron Mines Corp. almost missed its window to ship provisions to workers before winter arrives. The delay came not from the weather, but from a sudden freeze in the market for short-term debt 2,000 miles south in Toronto.
"We have 200 people to keep alive," Chief Executive Officer Gordon McCreary said in an interview in Toronto. "Our lifeline to getting critical materials to the north" was the C$43.8 million ($43.8 million) invested in commercial paper, he said.
The Canadian cash crunch that started with defaults on subprime mortgages in Southern California and Florida has hurt more than 25 companies that invested in commercial paper, including Sun-Times Media Group Inc. and Canada Post, the nation's mail service. Baffinland has 95 percent of its cash in Canadian commercial paper, debt that is due in 364 days or less.
Investors fled Canada's asset-backed commercial paper, paralyzing the C$40 billion market for debt that carried the highest credit ratings, after losses from home loans to people with poor credit histories roiled global credit markets.
Coventree Can't Pay
That left Baffinland and other investors in the lurch because 17 funds run by finance companies including Toronto— based Coventree Inc., Newshore Financial Corp. and Quanto Financial Corp., couldn't raise money to pay back lenders, according to ratings company DBRS Ltd.
Coventree managed C$16 billion in commercial paper funds with the highest ratings.
The funds run by companies such as Coventree paid interest of about 4.6 percent for 30 days, compared with three-month Canadian government bills that yielded 4.35 percent. The debt is backed by mortgages, corporate bonds, and car loans that typically yield as much as 1 percentage point more than commercial paper, according to Colin Kilgour, president of Connor Clark & Lunn Wholesale Finance, the structured credit and securitization unit of Connor Clark & Lunn Financial Group.
About 4 percent of Coventree's commercial paper was backed by subprime mortgages.
No commercial paper borrower had failed to pay on time in two decades and Toronto-based DBRS gave the securities its top rating of R-1. The funds also had backup lines of credit from banks should a market disruption shut down the market.
Canada's asset-backed commercial paper market doubled to C$120 billion since 2000, according to Moody's Investors Service in New York. Buyers snapped up the IOUs as government debt sales fell 60 percent to C$23.5 billion in the past decade after nine straight surpluses, according to the March budget.
`Concept of Risk'
"You can get what the bank pays you, which is not very much, or you can put it in asset-backed commercial paper, which have always been rated as high as you can get so there's never been any concept of risk," said Geoff Chater, a spokesman for Vancouver-based First Quantum Resources Minerals Ltd., a copper mining company operating in Africa.
First Quantum hasn't been repaid on C$7.5 million of debt issued by Coventree that matured on Aug. 14 and Aug. 15, he said. It had about 28 percent of its cash in commercial paper.
Six-Year Highs
Starting in July, growing defaults in U.S. home loans caused the cost of borrowing to increase for all but the most creditworthy companies. Rates on asset-backed commercial paper soared, rising to six-year highs in the U.S. as the three-month London interbank offered rate, or Libor, climbed to 5.82 percent from 5.35 percent. Libor is a benchmark for commercial paper rates.
Making matters worse banks, including Frankfurt-based Deutsche Bank AG and Barclays Bank Plc of London, refused to provide emergency financing. They said there was no market disruption because some of Canada's biggest commercial banks were able to refinance debt.
Investors began demanding yields of about 6.03 percent to own Coventree's commercial paper. On Aug. 13 the company said it couldn't find enough buyers to refinance C$950 million of short=term debt and its banks refused to provide emergency funds. Company spokesman Craig Armitage declined to comment.
"Anytime there's a reliance on short-term funding without specific alternative plans for liquidity, that's going to be suspect," said John Hollyer, principal at Valley Forge, Pennsylvania-based Vanguard Group Inc., which has $170 billion in money market funds under management. "That's the overriding lesson of what happened here."
Debt Extension
A group of 10 banks and pension funds agreed on Aug. 16 to convert C$35 billion of debt into notes maturing in as much as 10 years. Terms of the debt won't be released until mid-October, said Purdy Crawford, a lawyer at the Toronto firm Osler, Hoskin & Harcourt LLP who heads the group. Until then, investors won't know when they will get their money back, or whether they will be repaid in full.
Deutsche Bank spokesman Ted Meyer in New York declined to comment, as did Barclays spokesman Peter Truell, also in New York.
Companies invested in the debt in part because of the ratings from DBRS, formerly Dominion Bond Rating Service, said Robin Roopchan, director of investor relations at Ontario Power Generation in Toronto, which bought C$103 million of the securities, none of which has been repaid.
`Global Liquidity'
DBRS figured on banks providing funds, said Managing Director Huston Loke.
"We expected a combination of the market and liquidity providers would have carried investors through," Loke said in an interview. The disruption clause "took good care of the market for 18 years," he said.
DBRS said Sept. 12 it will change its rating rules and adopt a "global liquidity" standard to prevent debt getting the highest credit rating if banks can refuse to provide funding.
"The banks are saying there's no market disruption, and obviously there is a market disruption," said Troy Winsor, a spokesman for Redcorp Ventures Ltd., based in Vancouver.
Redcorp put 43 percent of its money in Coventree commercial paper on the advice of HSBC Canada, Winsor said. Redcorp is building a copper, zinc and lead mine in British Columbia.
Sharon Wilks, a spokeswoman in Toronto for HSBC Canada, a unit of HSBC Holdings Plc, Europe's biggest bank, declined to comment. HSBC is among the banks working on the debt plan.
`Driving On'
Canada Post had about 3.5 percent, or C$37.9 million, of its treasury investments in asset-backed commercial paper, according to John Caines, manager for media relations. The company is representing investors negotiating with the banks.
Sun-Times, the publisher of the Chicago Sun-Times newspaper formerly controlled by convicted felon Conrad Black, said it doesn't anticipate a "major capital loss" after two trusts failed to pay back C$48 million in commercial paper.
The company signed "standstill" agreements in August with both National Bank of Canada's Ironstone Trust and Coventree's Planet Trust to avoid taking legal action until Oct. 15, Sun— Times spokesman Tammy Chase said.
Baffinland bought commercial paper on the advice of Toronto-based Bank of Nova Scotia. McCreary wouldn't say how much interest he is now paying on the C$21 million credit line.
"We're driving on," McCreary said.
Normxxx
______________
The contents of any third-party letters/reports above do not necessarily reflect the opinions or viewpoint of normxxx. They are provided for informational/educational purposes only.
The content of any message or post by normxxx anywhere on this site is not to be construed as constituting market or investment advice. Such is intended for educational purposes only. Individuals should always consult with their own advisors for specific investment advice.
Wednesday, September 26, 2007
We Must Live Through All Time, Or Die By Suicide
As A Nation Of Freemen, We Must Live Through All Time, Or Die By Suicide. [¹]
Click here for link to complete article: http://jessel.100megsfree3.com/DXVLT.png
By Abraham Lincoln | 27 January 1838
At what point shall we expect the approach of danger? By what means shall we fortify against it?— Shall we expect some transatlantic military giant, to step the Ocean, and crush us at a blow? Never!— All the armies of Europe, Asia and Africa combined, with all the treasure of the earth (our own excepted) in their military chest; with a Buonaparte for a commander, could not by force, take a drink from the Ohio, or make a track on the Blue Ridge, in a trial of a thousand years.
At what point then is the approach of danger to be expected? I answer, if it ever reach us, it must spring up amongst us. It cannot come from abroad. If destruction be our lot, we must ourselves be its author and finisher. As a nation of freemen, we must live through all time, or die by suicide.

Click Here, or on the image, to see a larger, undistorted image.
Click here for link to complete article: http://jessel.100megsfree3.com/DXVLT.png
By Abraham Lincoln | 27 January 1838
At what point shall we expect the approach of danger? By what means shall we fortify against it?— Shall we expect some transatlantic military giant, to step the Ocean, and crush us at a blow? Never!— All the armies of Europe, Asia and Africa combined, with all the treasure of the earth (our own excepted) in their military chest; with a Buonaparte for a commander, could not by force, take a drink from the Ohio, or make a track on the Blue Ridge, in a trial of a thousand years.
At what point then is the approach of danger to be expected? I answer, if it ever reach us, it must spring up amongst us. It cannot come from abroad. If destruction be our lot, we must ourselves be its author and finisher. As a nation of freemen, we must live through all time, or die by suicide.
Click Here, or on the image, to see a larger, undistorted image.
Tuesday, September 25, 2007
New Buy Signal
Chart Spotlight: New Buy Signal [¹]
http://www.financialsense.com/editorials/swenlin/2007/0924.html
By Carl Swenlin, DecisionPoint.com | 24 September 2007
Ever since the market hit its correction lows in August I have written three articles, each emphasizing that the odds favored a retest of those lows (see Chart Spotlight on our website). As it turns out, we haven't had any decline that I would classify as a retest, and the market has broken out of a triangle formation on high volume. When the breakout happened, it eliminated any reasonable possibility of a retest, in my opinion. Sometimes the low odds take it.
One thing I have been cautioning about is to not get too bearish, because many of our key indicators had remained bullish. Another thing I should mention is that we should never get too invested in a forecast. I have watched as many of my bearish colleagues, after being proven wrong by the market, are still tying to justify their being bearish rather than trying to get aligned with the market. The market will eventually prove them right because, because, because . . . Maybe they will be right sooner than we think, but for now the market looks as if it will be moving higher for a while.
My bullish stance is due to our S&P 500 timing model having switched from neutral to a buy on September 13, three trading days prior to the Fed-induced market breakout. Also, prior to the breakout, about half of the market and sector indexes that we track with our primary timing model were also on buy signals. On the day of the breakout, the other half switched to buy signals.
The chart below shows the two components needed to generate a buy signal— the Percent Buy Index (PBI) crossed above its 32-EMA, AND the PMO (Price Momentum Oscillator) was above its 10-EMA. Note that the PBI is only at 59%, but it is trending up, which is most important.

Click Here, or on the image, to see a larger, undistorted image.
Bottom Line: The long-awaited retest did not materialize, and. in my opinion, the market has begun another leg upward that should challenge and exceed all-time highs for the S&P 500 Index.
Regardless of my personal opinion, we rely on the mechanical trend models to determine our market posture. Below is a recent snapshot of our primary trend-following timing model status for the major indexes and sectors we track. Note that we have added the nine Rydex Equal Weight ETF versions of the S&P Spider Sectors. This may seem redundant, but the equal weighted indexes most often do not perform the same as their cap-weighted counterparts, and they provide a way to diversify exposure.
M O R E. . .
Normxxx
______________
The contents of any third-party letters/reports above do not necessarily reflect the opinions or viewpoint of normxxx. They are provided for informational/educational purposes only.
The content of any message or post by normxxx anywhere on this site is not to be construed as constituting market or investment advice. Such is intended for educational purposes only. Individuals should always consult with their own advisors for specific investment advice.
http://www.financialsense.com/editorials/swenlin/2007/0924.html
By Carl Swenlin, DecisionPoint.com | 24 September 2007
Ever since the market hit its correction lows in August I have written three articles, each emphasizing that the odds favored a retest of those lows (see Chart Spotlight on our website). As it turns out, we haven't had any decline that I would classify as a retest, and the market has broken out of a triangle formation on high volume. When the breakout happened, it eliminated any reasonable possibility of a retest, in my opinion. Sometimes the low odds take it.
One thing I have been cautioning about is to not get too bearish, because many of our key indicators had remained bullish. Another thing I should mention is that we should never get too invested in a forecast. I have watched as many of my bearish colleagues, after being proven wrong by the market, are still tying to justify their being bearish rather than trying to get aligned with the market. The market will eventually prove them right because, because, because . . . Maybe they will be right sooner than we think, but for now the market looks as if it will be moving higher for a while.
My bullish stance is due to our S&P 500 timing model having switched from neutral to a buy on September 13, three trading days prior to the Fed-induced market breakout. Also, prior to the breakout, about half of the market and sector indexes that we track with our primary timing model were also on buy signals. On the day of the breakout, the other half switched to buy signals.
The chart below shows the two components needed to generate a buy signal— the Percent Buy Index (PBI) crossed above its 32-EMA, AND the PMO (Price Momentum Oscillator) was above its 10-EMA. Note that the PBI is only at 59%, but it is trending up, which is most important.
Click Here, or on the image, to see a larger, undistorted image.
Bottom Line: The long-awaited retest did not materialize, and. in my opinion, the market has begun another leg upward that should challenge and exceed all-time highs for the S&P 500 Index.
Regardless of my personal opinion, we rely on the mechanical trend models to determine our market posture. Below is a recent snapshot of our primary trend-following timing model status for the major indexes and sectors we track. Note that we have added the nine Rydex Equal Weight ETF versions of the S&P Spider Sectors. This may seem redundant, but the equal weighted indexes most often do not perform the same as their cap-weighted counterparts, and they provide a way to diversify exposure.
M O R E. . .
Normxxx
______________
The contents of any third-party letters/reports above do not necessarily reflect the opinions or viewpoint of normxxx. They are provided for informational/educational purposes only.
The content of any message or post by normxxx anywhere on this site is not to be construed as constituting market or investment advice. Such is intended for educational purposes only. Individuals should always consult with their own advisors for specific investment advice.
Housing: Negative Annual Returns
Continuation of Negative Annual Returns in Housing [¹]
By TheBigPicture | 25 September 2007
Case Shiller Housing Index July 2007

Click Here, or on the image, to see a larger, undistorted image.
Here's the excerpt that goes with it:
Note that all 10 regions covered are now in the red, and for the most part, rather deeply; Only Chicago and Denver are off by less than 1%.

Click Here, or on the image, to see a larger, undistorted image.
via TFS Derivatives
Great Housing chart, from an article in the Sunday NYT:

Click Here, or on the image, to see a larger, undistorted image.
courtesy of the NYT
Incidentally, not everyone was crying wolf. Some of us were adducing significant data proving the point.
Such is the life of a skeptic . . .
Mortgage Withdrawals Driving UK Consumer Spending, Also
We have, for several years now, highlighted the significance of Mortgage Equity Withdrawal (MEW) in the U.S. as a major source of consumer spending.
As MEW slows, so too will consumer spending.
It turns out that this phenomena is not limited to the U.S.: In Great Britain, where nearly all mortgages are adjustable APRs, MEW has been a major source of fuel for their consumer spending.
From Monday's WSJ:
Sources:
Summer Swoon Evident in the S&P/Case-Shiller® Home Price Indices
Sep 25, 2007 09:00 AM EST PDF
http://www2.standardandpoors.com/spf/pdf/index/CSHomePrice_Release_092512.pdf
S&P/Case-Shiller Home Price Index Falls 3.9% in July
Courtney Schlisserman
Bloomberg, Sept. 25 2007
http://www.bloomberg.com/apps/news?pid=20601087&sid=aqOuSeaFXx3Y&
They Cried Wolf. They Were Right.
VIKAS BAJAJ
NYT, September 23, 2007
http://www.nytimes.com/2007/09/23/weekinreview/23bajaj.html
Northern Rock May Point to U.K. Crunch
CARRICK MOLLENKAMP and MARK WHITEHOUSE
WSJ, September 24, 2007; Page A2
http://online.wsj.com/article/SB119058413986236614.html
Normxxx
______________
The contents of any third-party letters/reports above do not necessarily reflect the opinions or viewpoint of normxxx. They are provided for informational/educational purposes only.
The content of any message or post by normxxx anywhere on this site is not to be construed as constituting market or investment advice. Such is intended for educational purposes only. Individuals should always consult with their own advisors for specific investment advice.
By TheBigPicture | 25 September 2007
Case Shiller Housing Index July 2007
Click Here, or on the image, to see a larger, undistorted image.
Here's the excerpt that goes with it:
- "Data through July released today by Standard & Poor’s for its S&P/Case-Shiller® Home Price Indices, the leading measure of U.S. home prices, shows a continuation of negative annual returns in the 10-City Composite and the 20-City Composite, as well as 15 of the 20 metro area indices. Both composite indices have registered negative annual growth rates since the beginning of the year. In addition, both indices rate of decline has become larger in each of the seven months from January through July.
The chart above, depicting the annual returns of the 10-City Composite and the 20-City Composite, shows the 10-City Composite was down 4.5% versus July of 2006, while the 20-City Composite was down 3.9% over the same time period.
“The decline in home prices clearly continued into the summer months,” says Robert J. Shiller, Chief Economist at MacroMarkets LLC. “The year-over-year decline reported for the 10-City Composite is the lowest since July 1991. The lowest annual decline in this Index, which dates back to January 1987, was— 6.3%, which was reported in April 1991. The further deceleration in prices is still apparent across the majority of regions, with 16 of the 20 metro areas showing a drop in their annual growth rate from what was reported in June.”
- "Home prices in 20 U.S. metropolitan areas fell the most on record in July, indicating the threat to consumer spending was rising even before credit markets seized up in August, a private survey showed today.
Values dropped 3.9 percent in the 12 months through July, steeper than the 3.4 percent decrease in June, according to the S&P/Case-Shiller home-price index. The index declined in January for the first time since the group started the measure in 2001, and has receded every month since then.
Stricter lending standards and reduced demand are prolonging the housing slump, now entering its third year. Prices may continue to fall as homes stay on the market longer, economists said. Diminished housing wealth may spur households to pare spending, hurting economic growth."
Note that all 10 regions covered are now in the red, and for the most part, rather deeply; Only Chicago and Denver are off by less than 1%.
Click Here, or on the image, to see a larger, undistorted image.
via TFS Derivatives
Great Housing chart, from an article in the Sunday NYT:
Click Here, or on the image, to see a larger, undistorted image.
courtesy of the NYT
Incidentally, not everyone was crying wolf. Some of us were adducing significant data proving the point.
Such is the life of a skeptic . . .
Mortgage Withdrawals Driving UK Consumer Spending, Also
We have, for several years now, highlighted the significance of Mortgage Equity Withdrawal (MEW) in the U.S. as a major source of consumer spending.
As MEW slows, so too will consumer spending.
It turns out that this phenomena is not limited to the U.S.: In Great Britain, where nearly all mortgages are adjustable APRs, MEW has been a major source of fuel for their consumer spending.
From Monday's WSJ:
- "In the past decade, U.K. consumers have become more dependent on borrowed money, both to buy homes and to finance spending. As of July, total mortgage debt in the U.K. had reached £1.1 trillion ($2.2 trillion), more than double the level of 10 years earlier and equivalent to more than 80% of annual gross domestic product. In the first quarter of this year, U.K. homeowners tapped their home equity for about £13.2 billion, or 6.1% of disposable income, an indication of how much rising home prices have been raising consumer spending, which makes up about two-thirds of the U.K. economy."
- "Perhaps no company symbolizes the borrowing boom better than Northern Rock. In the late 1990s, the company became a pioneer in the securitization of U.K. mortgage loans, packaging thousands of loans into pools and selling the cash flows as securities to investors in the U.S. and Asia.
By tapping capital markets rather than relying solely on typical deposits, Northern Rock was able to expand at great speed. By June, it had about £87 billion in mortgage loans outstanding and had accounted for almost a fifth of new mortgage loans made in the first half. According to brokers, Northern Rock gained market share in part by taking risks— allowing home buyers, for example, to get loans covering as much as 90% of the purchase price.
Their mortgages "were prime, but they were operating at the outer limit of it," said Howard Cook, a partner at Talbot Insurance Services, an independent financial adviser in Cumbria, in northwestern England. A Northern Rock spokesman said the credit quality of the company's loans was solid, and that the percentage of loans in arrears was well below the industry average."
Sources:
Summer Swoon Evident in the S&P/Case-Shiller® Home Price Indices
Sep 25, 2007 09:00 AM EST PDF
http://www2.standardandpoors.com/spf/pdf/index/CSHomePrice_Release_092512.pdf
S&P/Case-Shiller Home Price Index Falls 3.9% in July
Courtney Schlisserman
Bloomberg, Sept. 25 2007
http://www.bloomberg.com/apps/news?pid=20601087&sid=aqOuSeaFXx3Y&
They Cried Wolf. They Were Right.
VIKAS BAJAJ
NYT, September 23, 2007
http://www.nytimes.com/2007/09/23/weekinreview/23bajaj.html
Northern Rock May Point to U.K. Crunch
CARRICK MOLLENKAMP and MARK WHITEHOUSE
WSJ, September 24, 2007; Page A2
http://online.wsj.com/article/SB119058413986236614.html
Normxxx
______________
The contents of any third-party letters/reports above do not necessarily reflect the opinions or viewpoint of normxxx. They are provided for informational/educational purposes only.
The content of any message or post by normxxx anywhere on this site is not to be construed as constituting market or investment advice. Such is intended for educational purposes only. Individuals should always consult with their own advisors for specific investment advice.
Subscribe to:
Posts (Atom)