By Nouriel Roubini | 30 November 2007
|
It is true that in the last two days the US stock market has recovered sharply after a significant 10% downward correction in the period from early October until Monday. But the most sensible interpretation of the upward move on Tuesday and Wednesday this week (in spite of an onslaught of lousy macro news: consumer confidence, existing home sales, Beige Book, fall in durable goods orders, regional Fed manufacturing reports, initial claims for unemployment benefits, expectations that Q4 growth will be closer to 0% after the revised 4.9% in Q3, sharply rising credit losses, falling home prices and a worsening housing recession, etc.) is that this is the last leg of a sucker rally (or dead cat bounce) driven by wishful hopes that the Fed easing will prevent a recession.
Certainly on Wednesday, the equities rally was totally driven by Fed governor Kohn signaling the obvious, i.e. that given that the liquidity and credit crunch is now worse than at its August peak the Fed will cut rates in December, January and for as long as needed. In this game of chicken between the Fed and the bond market (with the latter signaling already for a while that the Fed will keep on cutting) the Fed was obviously the one to blink: this was no surprise to anyone who had noticed the meltdown in financial markets (an ugly liquidity and credit crunch) in the last few weeks. But for some reason the stock market only discovered on Wednesday what analysts, the bond market and credit markets had known all along— that the Fed will have to keep on cutting rates as we are headed towards an ugly recession that is now inevitable regardless of how much the Fed cuts rates.
The behaviour of the stock market since last August can be best interpreted in terms of a Bernanke Put, i.e., the stock markets' hope that a Fed easing will prevent a hard landing of the economy. The August liquidity and credit shock severely tested the stock market downward; then you had a first sucker rally on August 16th when the Fed announced the switch from a tightening bias towards an easing bias. A second phase of this sucker rally occurred on September 18th when the Fed surprised the markets with a 50bps Fed Funds rate cut rather than the 25bps that the market expected. Then equities kept on rising, in spite of worsening economic and credit news, all the way until October 9th. Then, a drumbeat of weaker and weaker economic and credit news started to take a toll again on the stock market and triggered the beginning of the stock market correction (10% fall in stock prices) that continued until last Monday November 26th. A third phase of this sucker rally occured after the Fed cut rates on October 31st triggering another stock market rally that turned out to be brief as a bombardment of awful credit news and weak economic data pushed down the market again.
The current leg of the sucker rally started Wednesday— with stock prices sharply up— when Kohn effectively signaled to the markets that— in spite of all the Fed rhetoric to the contrary in the last few weeks— the Fed would ease rates in December and for as long as needed to deal with the liquidity and credit crunch and to avoid a recession. In each case in the last few months the stock market has rallied when the Fed has signaled a willingness to ease monetary policy to avoid a recession.
The same pattern of market delusion and serial sucker rallies occurred in 2001: the economy entered in a recession in March 2001 but the S&P 500 index rallied by a whopping 18% in April and May because the market and investors expected that the aggressive Fed easing— that had started in January— would prevent a 2001 recession (the famed and deluded hope of a second half of 2001 "growth rebound" that never occurred). It was only in June when it was obvious that the economy was still sinking in spite of the Fed's hold on rates [[but not until after a final coup de grâce of 50bpts! : normxxx]] that the stock market started to sharply fall again; so then and again now the onset of a recession led to a typical sucker rally fed by expectations of a Fed bailout of the economy; and the latest rally this week is occurring while the liquidity crunch and credit crunch in the markets are as bad now or worse than in August and while the news is worsening by the day. Indeed the 2008 recession will repeat the Fed cycle and stock market cycle of the 2000 - 2001 recession: then the Fed tightened rates all the way to 6.5% in June 2000 and kept a tightening bias in July, September, November as it was worried more about inflation than about growth (that had been as strong as 5% in Q2 of 2000 but was sharply deceleraring by H2 of 2000 as the tech boom went bust). The Fed was totally mistaken then about its assessment of the effects of the tech bust on the economy and kept on worrying about inflation while growth was plunging after Q2 of 2000; it was only at the mid December 2000 FOMC meeting, when the signals were that the holiday sales would be awful, that the Fed suddenly switched from its November FOMC tightening bias to an easing bias. And two weeks later when, after lousy holiday sales data, the NASDAQ fell 7% on its first 2001 trading day of January, the Fed started to cut the Fed Funds rate aggressively with a an initial 50bps inter-meeting cut that day. Then as now, you had a sucker rally following the Fed easings that intensified in April and May 2001 as the Fed kept cutting rates. Indeed, not only the Fed got it wrong on the coming recession in the 2000 - 2001 period; but the professional forecasters also got it wrong, as an Economist magazine poll in March 2001 (when the recession had already started) showed that 95% of the forecasters believed that a recession would be avoided as the aggressive Fed easing would lead to a H2 growth rebound. And, as discussed above, even the stock market got it wrong as the 18% final sucker rally (or last dead cat bounce) in April and May 2001 was followed by a massive bear market starting in June 2001 as the economy spun down into a deeper recession in spite of the aggressive Fed ease. |
To take a longer and more analytical perspective, notice that typically a sucker rally occurs at the beginning of an economic slowdown that leads to recession. The initial reaction of markets to a flow of bad economic news is usually a stock market rally based on the belief that a Fed pause (like the rally following the August 2006 Fed pause) and then possibly easing will rescue the economy. This rally always ends up being a sucker rally as, over time, the anticipated beneficial effects of a Fed ease meet the reality of the investors realization that a recession is coming and that the effects of such a recession on profits and earnings are first order, while the effects of the Fed easing on the economy and stock market are— in the short run of a recession— only second order.
That is why we have had several sucker rallies this fall— every time the Fed eased rates or surprised markets with greater easing than expected or signaled to markets that it would ease ahead (as on Wednesday). But, as the continued flow of poor economic news increases the general expectation of a looming recession, the equity markets will— in due course— fall sharply when the successive waves of negative news and macro developments hits an already weakened and vulnerable economy hard; then you will see a serious bear market in equities. So, equities came under great pressure in July and August when the credit market very nearly froze and the financial news turned very negative; they rallied only after the August 16th and September 18th Fed surprises; and turned into a negative 10% after October 9th when the news became awful again.
It is well known— from basic macroeconomic theory— that the equity market reaction to poor growth news is ambiguous. Lower than expected growth leads to a higher stock market value via the "lower interest rate expectation channel" and to a lower stock market value via the "lower profits/earnings expectation channel". The former effect derives from the fact that bad economic news increase the probability that the Fed will ease monetary policy and thus stimulate the economy, demand and profits. The latter channel derives from the fact that slower growth— or even worse an outright recession— will lead to lower demand, lower revenues and lower profits. Indeed, as stock prices are forward looking, and nominally equal to the discounted value of dividends where the discount rate is related to an appropriate measure of interest rates, bad growth news affects both the numerator and denominator (both are expected to decrease) of the ratio of dividends to the appropriate discount rate. Usually, the first effect (the denominator) dominates at the beginning of an economic slowdown— when the likelihood of a slowdown is high but the likelihood of a true hard landing or recession is still low and unclear: then the interest rate channel dominates the profits channel. But once the signal of a hard landing or recession become clearer and the likelihood of such hard landing sufficiently high, the profits channel (the numerator) dominates the interest rate channel.
Why is this conceptual discussion important? Now that the likelihood of a recession has increased— even in the eyes of otherwise soft landing analysts— one is starting to hear and read with increasing frequency such Goldilocks statements such as "a hard landing will be good for stocks" or "the stock market can rally during a recession" or "the Fed will most certainly rescue the markets if there is a recessionary hard landing" or "P/E ratios are low and earnings yields are much higher than bond yields, thus the stock market is now undervalued".
|
To clear the air from the spin that one is increasingly hearing, it is useful to ask a simple factual question: what is the relation between stock markets and recessions? So, for a moment, let us leave aside the issue of whether my recession call is correct or not. But let us assume, for the sake of argument, that a recession is coming and then ask the question: if we have a recession, what will happen to the stock market? So, you don't have to believe in a recessionary hard landing to consider this specific question. You just need to ask yourself— what happens to stock prices when recessions do come.
Luckily we have enough data from previous recessions and stock prices to give an answer to this question. Consider the charts below. They present the percentage change in that S&P500 index around the time of the last six U.S. recessions (i.e. starting with 1970)— in the months before the start of a recession, in the months during a recession, and in the months after it. The vertical lines in each chart represents the peak of the business cycle (the beginning of a recession) and its trough (end of a recession). On average the stock market does not change much between the peak and the trough of the business cycle: on average the fall is only 0.4% between peak and trough; in some recessions— such as the 1974 - 1975 one— the peak-to-trough fall is fairly deep (-13%), but in others— such as the 1980 one— stock prices actually rose 5.8% between peak and trough. So 0.4% is an average for all recessions, but scarcely captures the variability.
This may seem like a relatively small market change, but the peak-to-trough comparison is deceptive. It is deceptive because, usually, the stock market starts to fall apart well before a recession starts (even before the business cycle/boom peaks), then falls very sharply during the first stage of a recession, and finally starts to recover in the late stages of a recession (even before the business cycle/recession has reached its trough). Specifically, the stock market fall from the peak of a business cycle to the nadir of the business cycle averages 17.5%; and in every one of these six recessions you have the same pattern: initially stock prices fall sharply before the economy enters recession. Then, the recovery of the stock market starts before the trough of the business cycle— before the economy has begun recovering from the recession.
|
Note again that, in most episodes, the stock market peaks a few months before the formal peak of the business cycle and starts falling before the onset the recession. Therefore, the average fall of the stock market from its business cycle peak to its business cycle low is well above 17.5%. In fact, this average fall in stock prices from its just pre-recession peak to its near end of recession bottom is actually close to 28%, an extremely severe fall.
So we can see that the peak-to-trough, almost flat, average behavior of the stock market conceals a much sharper fall over the course of a recessionary episode (starting just before the peak of the prior boom cycle), followed by an equally sharp recovery in the late stages of the recession. This pattern makes sense, as equity prices are forward looking and tend to reflect all imnmediately available information about the expected path of earnings, dividends, and interest rates. The stock market starts to fall early because the closer you get to the peak of the business cycle, the higher is the probability that a recession will occur and will thus drag down profits [[actually, I would maintain that, the closer to the peak, the more the financial/economic conditions that have contributed to that peak have (relatively) deteriorated; therefore, the market does not have to be prescient: normxxx]]. So, a 'forward looking' equity market peaks before the peak of the business cycle and starts falling before the actual recession has started. That is why stock prices tend to be a good— if imperfect— leading indicator of the business cycle end [[and explains why the market alone often fails as an indicator, since the conditions it is 'seeing' may recover short of a recession: normxxx]].
The fall in the stock market from its peak of the business cycle to its lowest level in the following recession was 21.0% in the 1970 recession, 33.88% in the 1974 - 75 recession, 10.6% in the 1980 recession, 18.2% in the 1981 - 82 recession, 14.6% in the 1990 recession, and 10.3% [[[sic] I believe it was actually 38% from peak to trough for the Dow and 46% for the S&P: normxxx]] in the 2001 recession. In 1970, the stock market peaked 9 months before the recession and fell 12% before the recession started. In 1973 - 75, the market peaked 12 months before the start of the recession and fell 23% before the recession formally started in December 1973, with a good half of this pre-recession drop right after the beginning of the Yom Kippur war that led to Arab oil embargo. One exception is 1980 when the stock market actually rose in the months just before the start of the recession in February. In 1981 - 82, the stock market peaked four months before the onset of the recession and then fell about 4% before the recession actually started. In 1990, the stock market peaked two month before the recession and fell about 2% before the start of the recession. In the 2001 episode, the S&P peaked about seven months before the start of the recession in March 2001 and then fell by 31% before the recession started. (The peak of the Nasdaq was even earlier, in March 2000 a full year before the onset of the recession.)
Of course, in the last few decades, sometimes U.S. stock prices have fallen and a recession has not materialized— stock markets are not a perfect and always correct leading indicator of a recession. But, and this is most important in the context of the question asked above, almost every time a recession did occur, the stock market fell sharply [[only one false negative! : normxxx]]. The issue is not whether the stock market has at times provided incorrect signals of the business cycle; rather, the issue is whether a hard landing and the onsets of recessions are associated with sharply falling stock prices. And the simple and unequivocal answer is that recessions lead to very bearish stock markets where from the peak in the economy to the trough in the stock market the fall is about 17.5%, whereas the peak-to-trough in the stock market (i.e. the pre-recession market peak to the near end of recession market botttom) is about 28%. So, hard landings and recessions do lead to bear stock markets, but the markets usually provide an early warning. The recent market buzz and chatter about hard landings and recessions "being good for the stock market" is counter-factual and utter nonsense based on the historical data.
The fact that the stock market begins recovery before the trough of the business cycle is reach is also logical and based on the forward looking nature of stock prices: even before a recession has ended the rate of the fall in economic activity tends to decrease markedly. (In the early stage of a recession, the first derivative of output is negative, indicating negative growth, while the second derivative shows an acceleration of the rate of economic contraction. In the late stage of a recession, the first derivative is still negative but the second derivative shows a deceleration of the rate at which the economy is contracting and signals that the trough of the business cycle may be close. Thus, it is not necessary to wait until the recession is over for stock prices to anticipate better earnings and dividends.
How about "soft landing" episodes, i.e. episode where a Fed tightening did not lead to an outright recession but rather to a significant slowdown of the economy and then an economic recovery? The only recent episode of a successful soft landing is 1994 - 95 when a 300bps tightening by the Fed in 1994 led to a relatively sharp slowdown in the economy. But even in that episode, the Fed risked overdoing it and eased the rate in 1995 only when the slowdown in the economy already appeared as excessive. Note that, in that episode, the economy was just recovering from a painful recession that, while formally ended in 1991, was still followed by job-loss and a very slow job (the famous "job-less") recovery of 1992 and 1993. Only by early 1994 was the economy showing signs of healthy growth and employment recovery.
So the monetary tightening of 1994 - 95 was bound to be a lot more tentative on the part of the Fed (and the business cycle was at a much healthier stage)— the Fed was largely bringing the Fed Funds rate back to a more 'neutral' level (if rather abruptly) after its sharp easing during the 1990 - 91 recession. In terms of the market consequences of such a "soft landing", the S&P500 fell by 5% between January and December 1994 as the Fed tightening was under way and the economy was starting to decelerate. Thus, while the S&P had started to recover briskly after the 1990 - 91 recession, and had double digit returns both in 1992 and 1993 (and subsequently from 1995 on), the "soft landing" of the economy in 1994 led to a significant fall in the stock market. The underlying trend in the market index of the double digit annual recovery in 1992, 1993, and after 1995, implied an underperformance of the stock market relative to trend was of the order of 17%, i.e., without the soft landing slowdown of 1994 the market could have grown— based on the underlying trend of the S&P— by a further 17%.
What are the potential caveats to the arguments above that a US recession would lead to a sharp drop in the stock market? Some argue that the sharp fall in equity prices during previous recessions occurred after long periods in which the market was bullish and sharply increasing; thus, close to the recession P/E ratios were already excessively high and bound to adjust; also the monetary and credit tightening in previous recessions squeezed profits severely and pushed equity prices lower.
Today, it is argued that conditions are very different from such previous growth slowdowns: equity prices zig-zagged without much of a strong trend from 2002 to 2005 and have grown only 'modestly' since, while earnings have sharply increased. Thus, the argument goes, P/E ratios are now relatively low and valuations are not inflated [[moreover, by historical standards, monetary policy is 'easy'— and preparing to ease further: normxxx]]. If anything, given the surge in earnings valuations, the ratios are relative low and bound to rise if a "soft landing" occurs, or not fall much even if a "hard landing" does occur. Specifically, unless a major credit crunch leads to a sharp fall in profits and earnings, equity valuations may not be as much at risk in a US hard landing scenario.
|
The above arguments require a whole separate discussion of earnings and profits and their likely future trends that will be discussed in another note. For now, let us observe why these arguments are not convincing. First, in a recession, revenues fall and both profits and earnings sharply fall; so equity valuations need to take a hit; and while recessions triggered by a credit crunch or a monetary tightening have more severe effects on corporate profits, even recessions triggered by the bursting of a bubble— the tech bubble in 2000, the housing bubble today and its consequent credit crunch— can severely affect earnings and thus valuations. In a typical US recession NIPA profits fall by about 20% and corporate earnings fall by more than NIPA profits— closer to 30% plus. Such a drop in profits and earnings has devastating effect on stock prices.
Second, recent data on Q3 earnings already suggest a fall in earnings in Q3 of 8.3% relative to a year ago and a fall in earnings relative to Q2. Third, on a (business) cycle adjusted basis, P/E ratios are still very high: especially as both profits and earnings now look peaky and bound to sharply slow and/or fall in growth, P/Es are likely much too high considering the likelihood of a hard landing and the consequent sharp fall in earnings. Of course, the fact that valuations have been relative moderate for a number of years may imply that not all stocks will be hit as hard in a recession: many will gradually fall during the economic downturn but others, that have low valuations now and whose earnings would be less affected by a recession, may do relatively better or not as bad as the overall market. It may also be the case that, the stock market will fall by less than the average in a typical recession. Still, it is hard to avoid the conclusion that a recession would be really bad for the stock market. In every previous recession equities have done very poorly and it is hard to make a logical or empirical argument why in the next recession things would be meaningfully different.
Finally, notice that the equity valuations of homebuilders, financials, and discretionary consumption firms have already followed the pattern that I described above: a sharp fall in earnings followed by a sharp fall (about 20% or more in equity valuations).
The discussion above clarifies what one should expect if— as I have predicted— the current US slowdown accelerates into a recession: based on historical experience the stock market is likely fall sharply by about 28% from its peak to its trough before it starts to recover in the late stage of the recession.
|
So beware of the large amount of spin that is being peddled by bulls that are only now starting to recognize that a recession is likely: they need to spin the bad news about the economy as suggesting that such bad news is actually very good news for the stock markets or that the Fed will be able to prevent such a recession. For these perma-bulls good economic news is very good for the stock market and bad economic news is also very good for the stock markets— as exemplified by the reaction ("I guess it is probably a buying opportunity") to my recession call by a recent Squawk Box anchor interview suggests. But savvy investors will not allow themselves to be fooled by such non-sequitur arguments and will cautiously adjust their portfolio to reduce the risk of being stuck in a bear market once the recession actually gets under way.
|

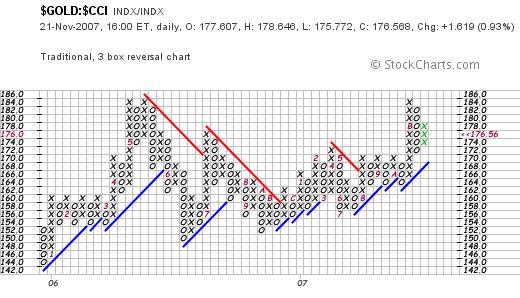
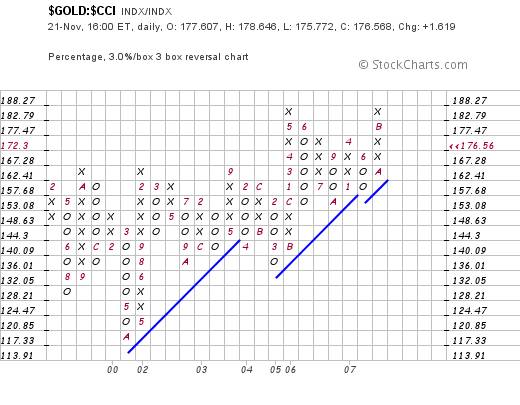
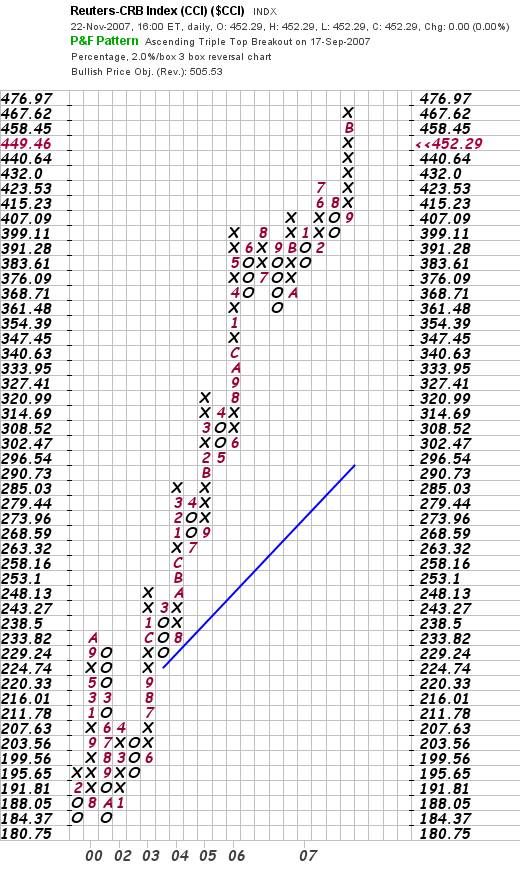
Click Here, or on the image, to see a larger, undistorted image.

Click Here, or on the image, to see a larger, undistorted image.

Click Here, or on the image, to see a larger, undistorted image.

Click Here, or on the image, to see a larger, undistorted image.

Click Here, or on the image, to see a larger, undistorted image.

Click Here, or on the image, to see a larger, undistorted image.
ߧ
Normxxx
______________
The contents of any third-party letters/reports above do not necessarily reflect the opinions or viewpoint of normxxx. They are provided for informational/educational purposes only.
The content of any message or post by normxxx anywhere on this site is not to be construed as constituting market or investment advice. Such is intended for educational purposes only. Individuals should always consult with their own advisors for specific investment advice.